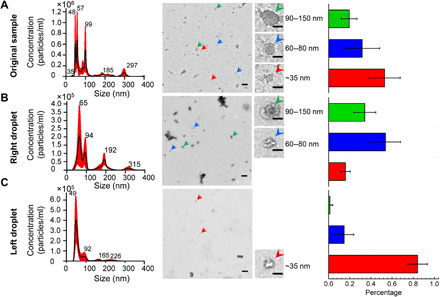
Fig. 6. Exosome subpopulation separation and transport in an acoustofluidic centrifuge.

(A) The particle size distribution (left) of the original sample analyzed using NTA. The corresponding transmission electron microscopy (TEM) image (middle) is taken from each respective sample. Insets: Magnified images of the exosome sample with different sizes, with plots providing the total particle size distribution as measured in each TEM image. (B) The particle size distribution of the sample in the right droplet after the separation and transport process, and corresponding TEM images and plots. (C) Particle size distribution of the sample in the left droplet. Particles with a diameter less than 50 nm are transported from the right droplet to the left. The corresponding TEM image and plots are also provided. Scale bars, 200 nm (TEM image) and 50 nm (insets). Each set of the NTA data was obtained from at least three NTA assays. The black line and the red area represent the fitting curve and the error bar, respectively. For each individual sample used for NTA measurement, five subsamples are collected and combined to provide sufficient particle numbers for measurement. Each counted particle percentage plot is averaged from TEM images from five individual trials (see table S2 for detailed count and percentage for each sample).
