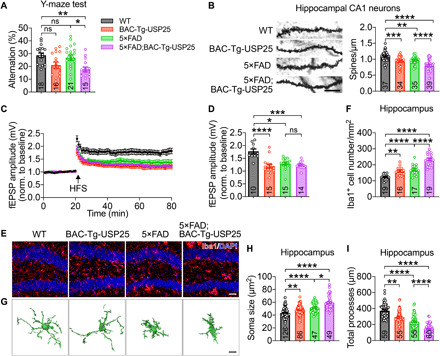
Fig. 2. Overexpression of USP25 promotes synapse loss and microglial activation in AD mice.

(A) Percentage of spontaneous alternation in the Y-maze. n = 15 to 21 5-month-old mice per group. (B) Golgi staining and quantification of dendritic spines in the hippocampal CA1 regions of 6-month-old WT, BAC-Tg-USP25, 5×FAD, and 5×FAD;BAC-Tg-USP25 mice. Scale bar, 10 μm. n = 4 mice per group; n = 34 to 39 dendrites per group were counted. (C) Hippocampal CA1 LTP recordings from 6-month-old mice. HFS, high-frequency stimulation. (D) fEPSP amplitude quantification during the last 10 min of LTP recording. WT (n = 5 mice, 10 slices), BAC-Tg-USP25 (n = 5 mice, 15 slices), 5×FAD (n = 7 mice, 15 slices), and 5×FAD;BAC-Tg-USP25 (n = 5 mice, 14 slices). (E and F) Representative immunostaining (E) and quantification of Iba1+ microglia (F) in 6-month-old WT, BAC-Tg-USP25, 5×FAD, and 5×FAD;BAC-Tg-USP25 mouse hippocampus. Scale bar, 40 μm. n = 5 to 7 mice per group; n = 16 to 19 slices per group were scored. (G) Representative 3D reconstruction of Iba1+ microglia. Scale bar, 8 μm. (H and I) Quantification of microglial soma size (H) and total processes (I). n = 3 to 5 mice per group; n = 47 to 126 microglia per group were counted. All data represent means ± SEM. P values were determined by one-way ANOVA with Tukey’s post hoc analysis in (A), (B), and (F) and by the Kruskal-Wallis test with Dunn’s post hoc analysis in (D), (H), and (I). ns, not significant. *P < 0.05; **P < 0.01; ***P < 0.001; ****P < 0.001.
