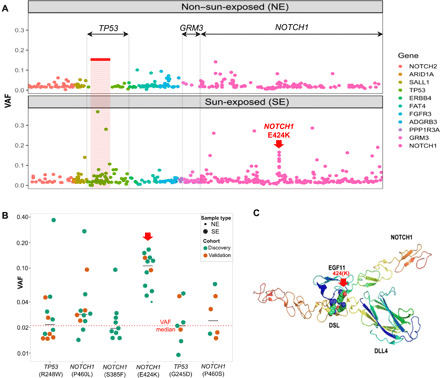
Fig. 2. Hotspots and mutations associated with UV exposure.

(A) All mutations are ordered by their genomic locations. x axis: The order of the mutation’s genomic location. y axis: Variant allele fraction (VAF) of individual mutations. The color depicts the gene harboring the mutations. The three genes demonstrating significant difference between SE and NE, either on the gene level or segment level, were labeled on top (TP53, GRM3, and NOTCH1). One specific mutation with elevated VAFs (NOTCH1 E424K) is indicated with a red arrow. (B) The VAF of the six individual mutations that are significantly enriched in SE versus NE epidermis in the primary discovery (green) and validation (orange) datasets. The dotted red line represents median VAF of all mutations, and black lines indicate the median of each group. (C) The predicted protein complex structure of NOTCH1 and DLL4 to show the position of the mutant E424K and the interacting partners, DLL4 K189/R191, in wild type.
