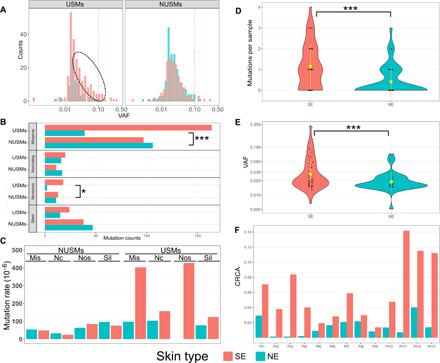
Fig. 3. UV-induced DNA damage assessed by USMs.

(A) Only USMs are associated with sun-exposure status. Left: Higher numbers of USMs are in SE than NE skin. Right: NUSMs are almost equally presented in SE and NE samples. The red dotted line indicates high VAF (>0.1). The black dotted ellipse indicates additional USMs in SE compared with NE skin. (B) The numbers of mutations by each amino acid–change type in SE/NE, grouped by USMs and NUSMs. (C) Normalized mutation rate of each effect group, measured as the numbers of observed mutations per sample per million possible mutations within the current panel. Effect groups by amino acid–change type: Mis, missense; Nc, noncoding; Nos, nonsense; Sil, silent. Overall distribution of the numbers of USMs per sample (D) and the VAFs of the mutations (E) using the 2-mm punch size. Inside the violin plots: black dots, individual samples; yellow dot with bar, averaged value with SD. SE samples are associated with higher numbers of USMs, as well as higher VAFs indicating potential larger clones. (F). Cumulative relative clonal areas (CRCAs) were higher in SE than NE skin of all 13 patients, with the ratios of SE/NE ranging from 1.4 to 55.0 (mean, 11.2). Statistical tests used: (B) Fisher’s exact test with multiple test correction implemented using the FDR method and (C and D) Wilcoxon test; *P < 0.05 and ***P < 0.001.
