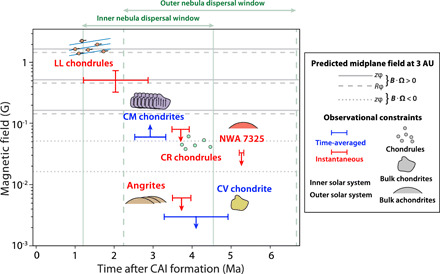
Fig. 7. Paleomagnetic constraints on nebular field as a function of time.

Red and blue colors denote the instantaneous (red) and time-averaged (over >1 to 106 years) (blue) paleointensities, respectively, from LL (10, 155) and CR chondrules (160), bulk samples of CM chondrites (134), NWA 7325 (124), angrites (164), and a CV chondrite (163), and spacecraft measurements comet 67P/Churyumov-Gerasimenko (171). Downward (upward) arrows indicate upper (lower) limits. Horizontal lines show the predicted midplane field at 3 AU assuming that magnetic stresses are driving accretion around a 1 M⨀ star. Solid and dashed lines denote field assuming that the nebular field and sense of disk rotation are aligned, for which we assume contributions from both Rϕ (Eq. 2 with f = 50 and Lz~6H) and zϕ (dashed) (Eq. 3 with f′ = 10 and taking m = 10) stresses, respectively. Dotted line denotes field assuming that the nebular field and sense of disk rotation are anti-aligned, for which we assume contributions from just zϕ stresses (dashed) (Eq. 3 with f′ = 10 and taking m = 1). For each case, fields are estimated for three assumed different accretion rates: 10−9, 10−8, and 10−7 M⨀ year−1 (bottom, middle, and top lines). See tables S1 and S2 for source data.
