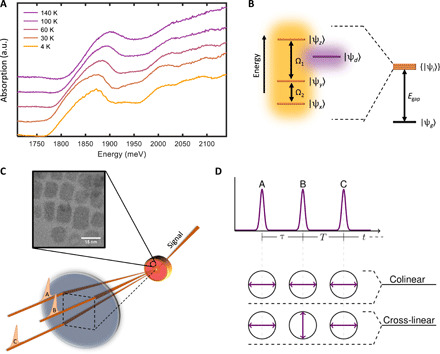
Fig. 1. CsPbI3 perovskite NCs studied via MDCS.

(A) Perovskite NC absorption spectra as a function of temperature (34). (B) Energy level diagram of the nondegenerate bright triplet states {Ψi = x,y,z} that comprise the band-edge transitions to and from |Ψg⟩. The dark singlet state |Ψd⟩ is shown to lie between states |Ψy⟩ and |Ψz⟩, which is argued in the main text. (C) Schematic of the MDCS experiment. Three pulses {A,B,C} are focused onto the sample with varying time delays. Inset shows a transmission electron micrograph of representative CsPbI3 NCs. (D) Excitation pulse sequence and excitation polarization schemes used to acquire one-quantum and zero-quantum spectra, in which double-sided arrows in circles denote the polarization of each pulse. Pulses A and C are horizontally polarized, and pulse B is either horizontally or vertically polarized, which corresponds to an emitted signal of either horizontal or vertical polarization respectively. a.u., arbitrary units.
