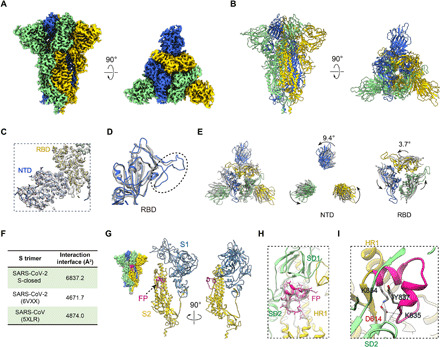
Fig. 1. A tightly closed conformation of SARS-CoV-2 S trimer.

(A and B) Cryo-EM map and model of SARS-CoV-2 S trimer in a tightly closed state, with three protomers shown in different color. (C) Close-up view of the model map fitting in the NTD and RBD regions of the S1 subunit, illustrating that most of the NTD region was well resolved. (D) Overlaid RBD structures of our S-closed (blue) with a cryo-EM structure of SARS-CoV-2 S in closed state (6VXX, gray), illustrating that the RBM S469-C488 loop was captured in our structure (indicated by dotted ellipsoid). (E) Top view of the overlaid structures as in (D) (left) and zoom-in views of specific domains, showing that there is a marked counterclockwise rotation in S1 especially in NTD, resulting in a twisted, tightly closed conformation. (F) Protomer interaction interface analysis by PISA. (G) Location of the captured FP fragment (in deep pink) within the S trimer (left) and one protomer. S1 and S2 subunits are colored steel blue and gold, respectively. (H) Model map fitting for the FP fragment. (I) Close-up view of the interactions between D614 from SD2 and FP, with the hydrogen bonds labeled in dotted lines and the L828-F855 region in FP in deep pink.
