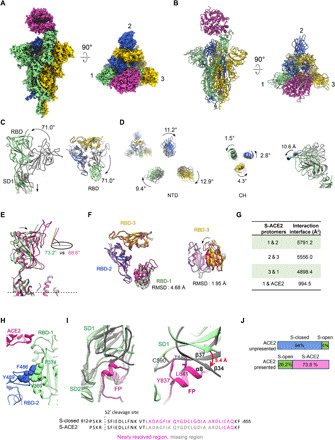
Fig. 2. The architecture of the SARS-CoV-2 S-ACE2 complex.

(A and B) Cryo-EM map and model of SARS-CoV-2 S-ACE2 complex. We named the RBD up protomer as protomer 1 (light green), and the other two RBD down ones as protomer 2 (royal blue) and protomer 3 (gold). ACE2 was colored in violet red. (C) Side and top views of the overlaid S-open (color) and S-closed (dark gray) structures, showing that in the open process, there is a 71.0° upward/outward rotation of RBD associated with a downward shift of SD1 in protomer 1. (D) Rotations of NTD and CH from the S-closed (gray) to the S-open (in color) state, with the NTD also showing a downward/outward movement (right). (E) Side view of the overlaid S-ACE2 (violet red) and S-open (light green) protomer 1 structures, showing that the angle between the long axis of RBD and the horizontal plane of S trimer reduces from the S-open to the S-ACE2. (F) Top and side views of the overlaid S-ACE2 (violet red) and S-open (color) RBD structures, showing the coordinated movements of RBDs. (G) Protomer interaction interface analysis of S-ACE2 by PISA. (H) Aromatic interactions between the core region of the up RBD-1 (green) and the RBM T470-F490 loop of the neighboring RBD-2 (blue). (I) Overlaid structures of S-ACE2 (gray) and S-closed (color, with the FP fragment in deep pink), indicating a downward shift of SD1 and most of the FP is missing in S-ACE2. Close-up view (right) of the potential clashes between the downward-shifted SD1 β34 and α8 helix of FP. (J) Population shift between the ACE2-unpresented and ACE2-presented S trimer samples.
