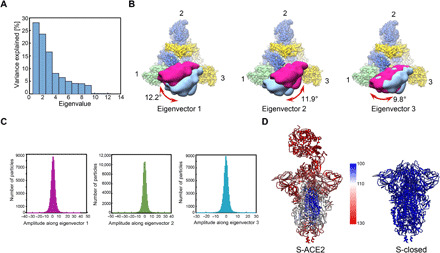
Fig. 4. Conformational dynamics of the S-ACE2 complex determined by multibody refinement.

(A) Contributions of all eigenvectors to the motion in the S-ACE2 complex, with eigenvectors 1 to 3 dominating the contributions. (B) Top view of the map showing the three swing motions of the first three eigenvectors, with S trimer following the color schema as in Fig. 2, and the two extreme locations of ACE2 illustrated in deep pink and light blue densities. The swing angular range and direction are indicated in dark red arrow. (C) Histograms of the amplitudes along the first three eigenvectors. (D) Atomic models of S-ACE2 and S-closed, colored according to the B-factor distribution [ranging from 100 (blue) to 130 Å2 (red)].
