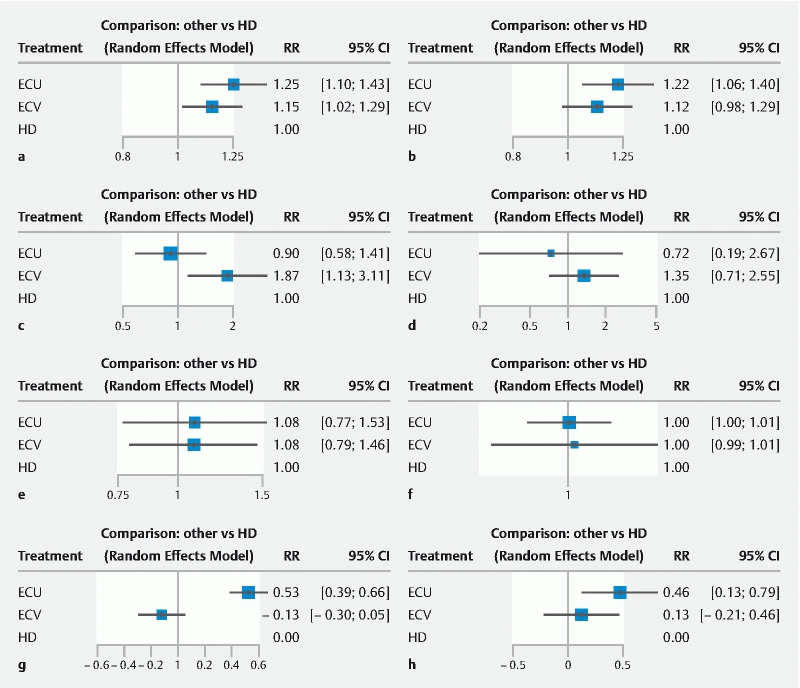
Fig. 3.

Forest plots for network meta-analysis a PDR, b ADR, c SADR, d NDR, e AADR, f CIR, g MPP, and h MAP. AADR, advanced adenoma detection rate; ADR, adenoma detection rate; CIR, cecal intubation rate; ECU, first-generation Endocuff; ECV, Endocuff Vision; HD, high-definition colonoscopy; MAP, mean adenoma per procedure; MPP, mean polyp per procedure; NDR, neoplasia detection rate; PDR, polyp detection rate. Note: Line represents a direct comparison, width of line corresponds to weight, overall effect and number of studies).
