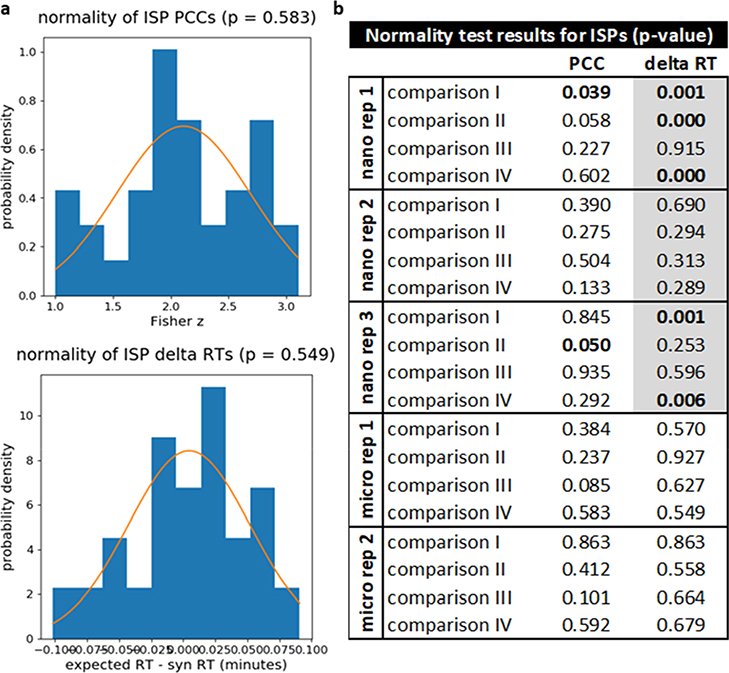
Figure 3.
Results of normality tests for PCCs and delta RTs obtained from ISPs. (a) Representative examples of plots showing the distribution of PCCs and delta RTs for ISPs along with a normal fit and p-value for the normality test (taken from comparison IV of micro-flow replicate 1). These plots are generated automatically by PSM_validator and are saved in the “normality” subfolder of the “Figures” folder for each analysis. (b) Results of all normality tests. For analyses involving micro-flow data, RT analysis was limited to the 12–70 min time range. For the nano-flow runs, the entire time range had to be included to avoid a large number of incomplete analyses. Gray boxes indicate analyses where the full time range was included. Bolded p-values were less than or equal to the significance threshold (α = 0.05), indicating that the distribution did not pass the test for normality.

