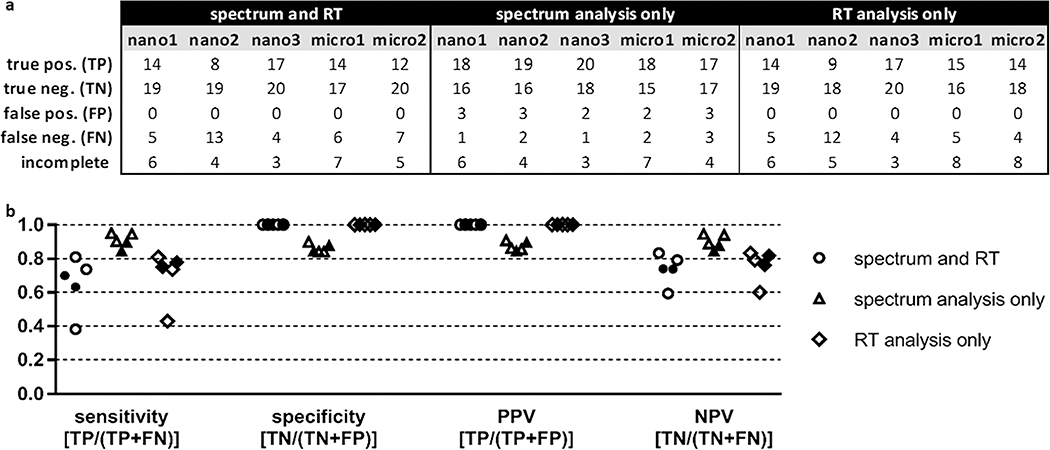
Figure 4.
Summary of nano-flow and micro-flow LC–MS/MS P-VIS benchmarking results using a statistically-determined PCC threshold and a statistically-determined delta RT threshold. (a) Accuracy of P-VIS at identifying matched and mismatched peptides was evaluated using the data from each technical replicate. For each replicate, the numbers reported are totals across all four pairwise comparisons performed for that dataset. Three different iterations of the data analysis were performed. First, performance was evaluated when the results of both spectrum analysis and retention time (RT) analysis were used to determine the validity of matches. Second, performance was evaluated when spectrum analysis alone was used to validate matches. Third, performance was evaluated when RT analysis alone was used. The same PSM_validator settings were used in all three iterations of the data analysis. Both the PCC threshold and delta RT threshold were statistically determined based on the results for the ISPs. RT analysis for micro-flow data was limited to the 12–70 min time range; RT analysis for nano-flow data included the entire time range of the experiment. The PSM_validator percentile threshold was set at 5% for all analyses. Pos = positive; neg = negative; incomplete = analyses not completed. (b) Sensitivity, specificity, positive predictive value (PPV), and negative predictive value (NPV) were calculated for each iteration of the data analysis (spectrum and RT, spectrum analysis only, and RT analysis only). Results from nano-flow experiments are shown with open shapes (three replicates), and results from micro-flow experiments are shown with filled shapes (two replicates). The equation for calculating each metric is indicated.

