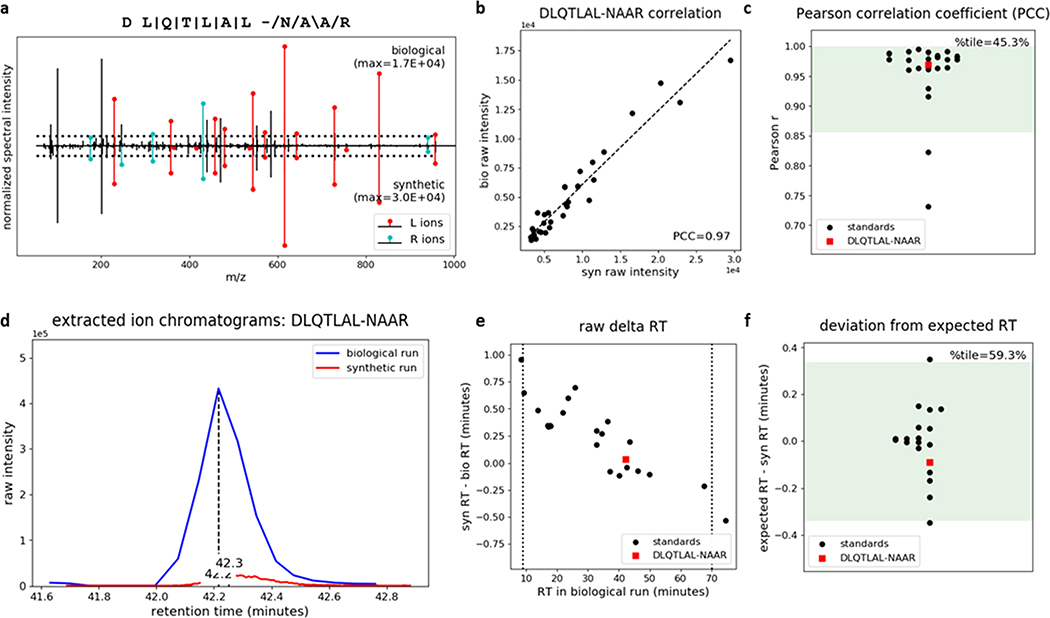
Figure 7.
P-VIS workflow confirms that the insulin-IAPP hybrid peptide 6.9HIP is present in mouse islets. Proteins extracted from mouse islets were fractionated by size exclusion chromatography (SEC), digested with the protease AspN, and analyzed by nano-flow LC–MS/MS. A database search identified the predicted 6.9HIP AspN cleavage product DLQTLAL-NAAR. To validate this identification, we applied the P-VIS workflow. Plots automatically generated by PSM_validator are shown. (a) Mirror plot displaying the spectrum from the biological sample (positive y-axis) and the spectrum from the validation sample (negative y-axis) that best matched the query sequence. Peak intensities are normalized to the most intense peak in each spectrum. The intensity of the tallest peak in each spectrum is indicated. In the sequence map, “\”, “/”, and “|” indicate that the spectrum from the biological sample contained a b ion, y ion, or both, respectively, corresponding to fragmentation at a given bond. The hyphen in the sequence indicates the location of the hybrid peptide junction. Horizontal dotted lines indicate the user-defined threshold for consideration of peaks in the PCC calculation. Ions corresponding to fragmentation of a bond to the left (L ions) or right (R ions) of the hybrid junction are labeled in red and cyan, respectively. (b) Raw intensities in the biological spectrum and the validation spectrum for all peaks included in calculation of the PCC. (c) Distribution of PCCs for internal standard peptides (ISPs). The distribution passed the test for normality (p = 0.146). Green shading indicates the 95% prediction interval based on one-tailed analysis. The PCC comparing the biological spectrum and the validation spectrum is also shown, and the percentile (%tile) is reported. (d) Extracted ion chromatogram showing the raw retention time for the biological peptide and the validation peptide. (e) Difference in RT for each of the ISPs between the two sample runs and the RT difference between the biological peptide and the validation peptide. Vertical lines indicate the time range considered in RT analysis (9–70 min). (f) Linear spline model based on the ISP data was used to model the relationship between RT in the two sample runs. The model was used to predict the RT of each peptide in the validation sample run based on the RT in the biological sample run. The difference between the expected and observed RT in the validation sample run (expected RT – syn RT) is reported. The distribution passed the test for normality (p = 0.393). Green shading indicates the 95% prediction interval based on two-tailed analysis. The difference between the biological peptide and the validation peptide is also shown, and the percentile (% tile) is reported.

