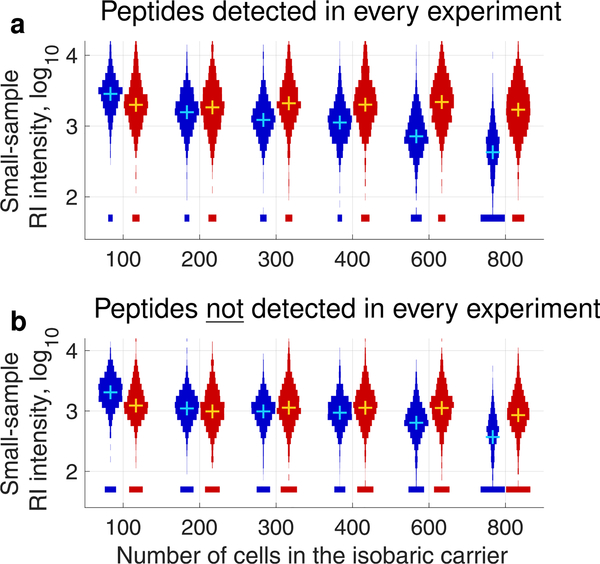
Figure 6.
Effects of increasing the size of the isobaric carrier on the RI intensities in the small samples. Both (a) and (b) show distributions of RI intensities from the small samples of the standards listed in Table 1. As shown in Figure 5, the blue distributions correspond to MS2 AGC = 50,000, and the red distributions correspond to MS2 AGC = 1,000,000. (a) Only the RI intensities for peptides identified across all experiments are shown to allow for a well-controlled comparison.12,24 (b) Only the RI intensities for peptides not identified across all experiments are shown to evaluate whether some of these peptides have a high enough RI intensity to be quantifiable. The means and medians of these distributions cannot be meaningfully compared because of nonignorable missing data.24

