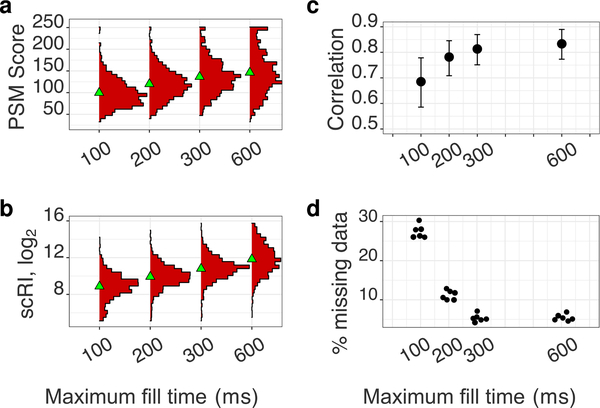
Figure 8.
Effects of increasing the maximum MS2 fill time from 100 to 600 ms for a standard with a 100-cell isobaric carrier. All peptides quantified across all samples at a 1% FDR are used for this analysis. (a) The confidence of sequence identification for peptides is shown as distributions of scores computed by Andromeda.25 (b) Distributions of RI intensities from the small samples (scRI) of a standard with a 100-cell isobaric carrier across all maximum fill times. (c) Correlations between the protein fold changes (between monocytes and HEK-293) estimated from the small samples and the isobaric carrier samples. (d) Fraction of missing RI intensities from the small samples as a function of maximum fill time.

