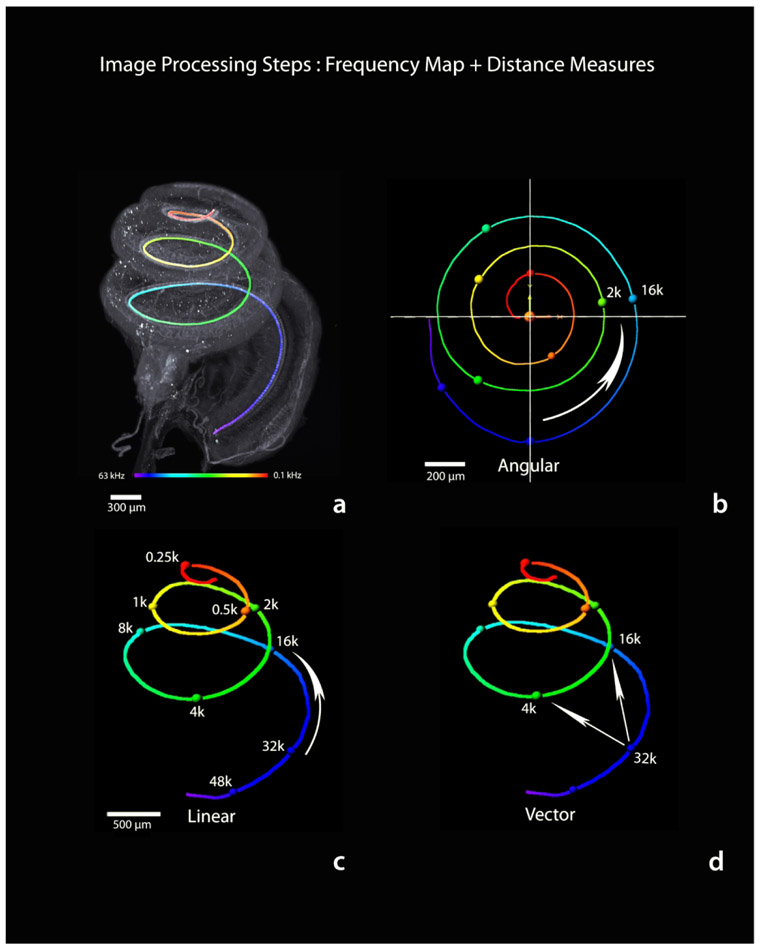
Figure 16.
Procedure for creating a three-dimensional frequency map of the basilar membrane (a) and measuring distance along that map (b-d). The inner hair cell filament trace (Figure 14 step 2) is converted to color-coded distance and the frequency-distance transformation is applied (a). For convenience in mapping across animals, spheres are placed at common octave frequency locations. Like hair cell counting, the frequency map can be extracted and freely rotated along any axis. This map may be used to make specific frequency related distance measurements, such as angular, linear or vector distance between any two frequencies. See also Table 1. Scale in c same for d.

