Figure 1.

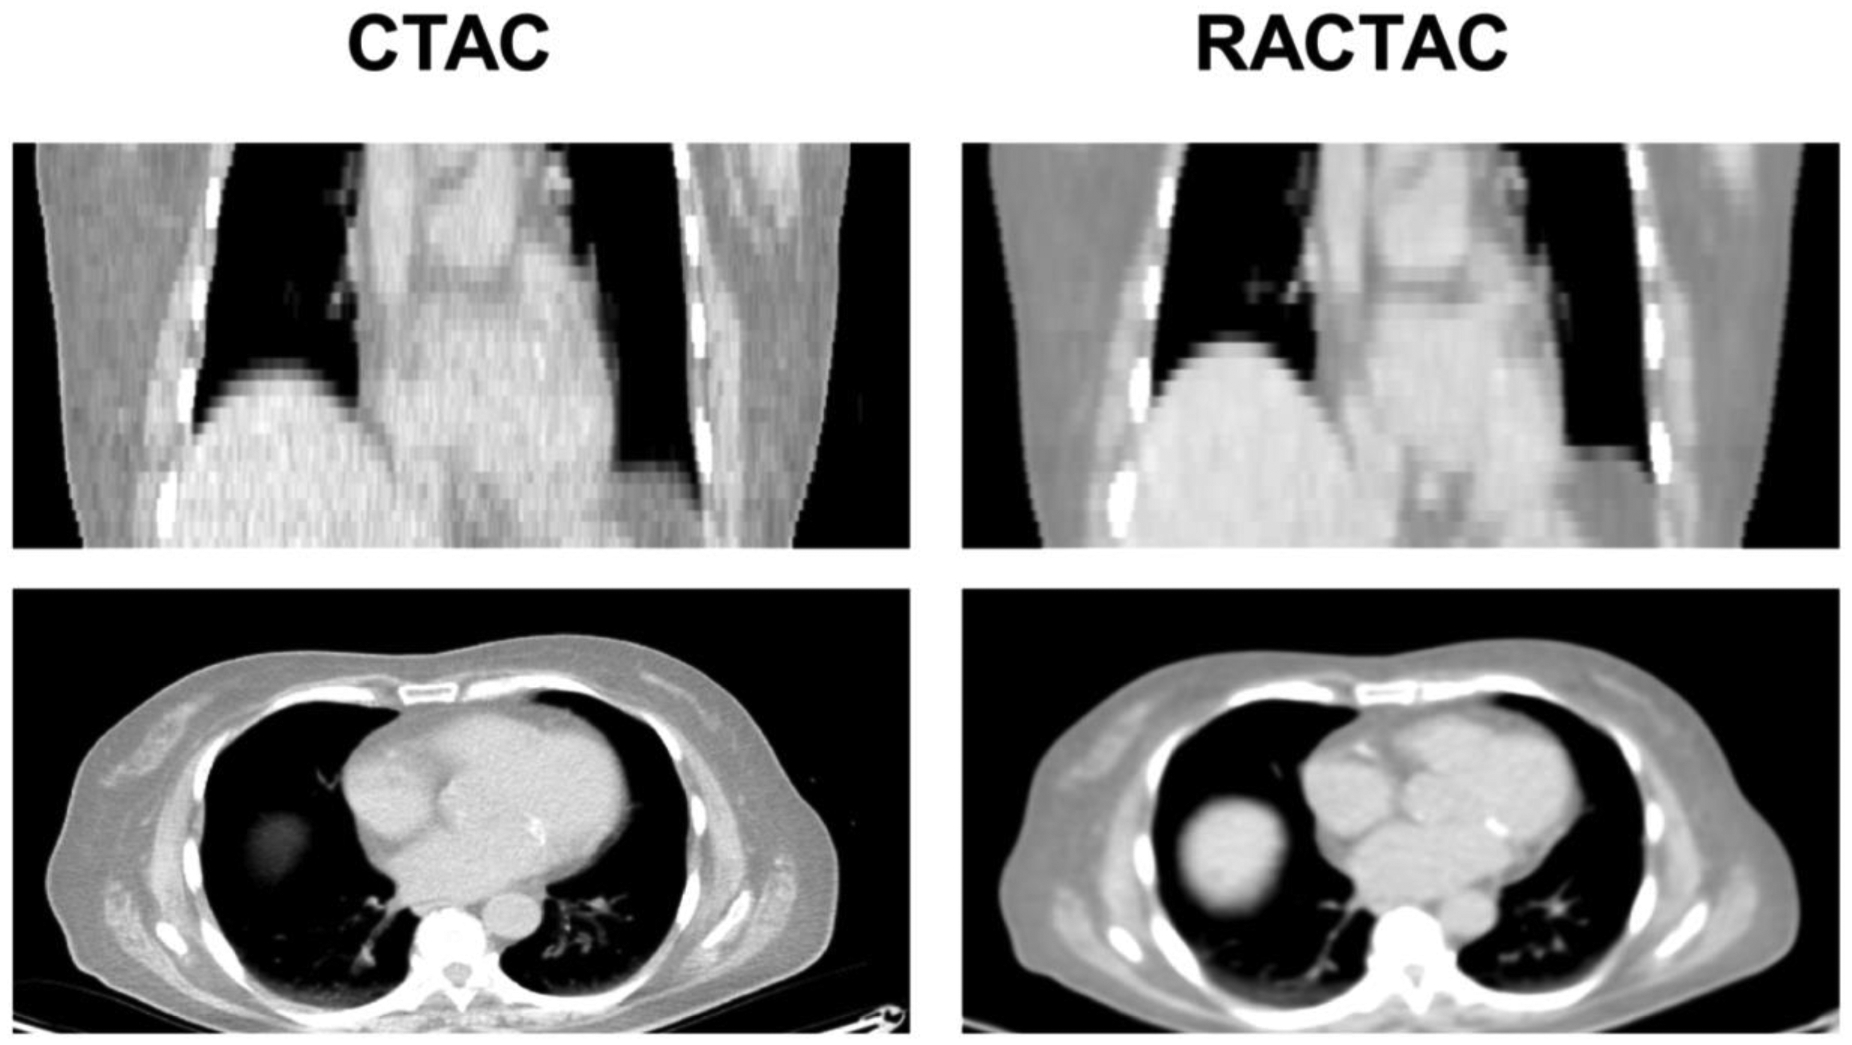
Standard attenuation map-CTAC (left) vs respiratory average CT attenuation maps-RACTAC (right). Coronal (top) and transverse (bottom) images.

Standard attenuation map-CTAC (left) vs respiratory average CT attenuation maps-RACTAC (right). Coronal (top) and transverse (bottom) images.