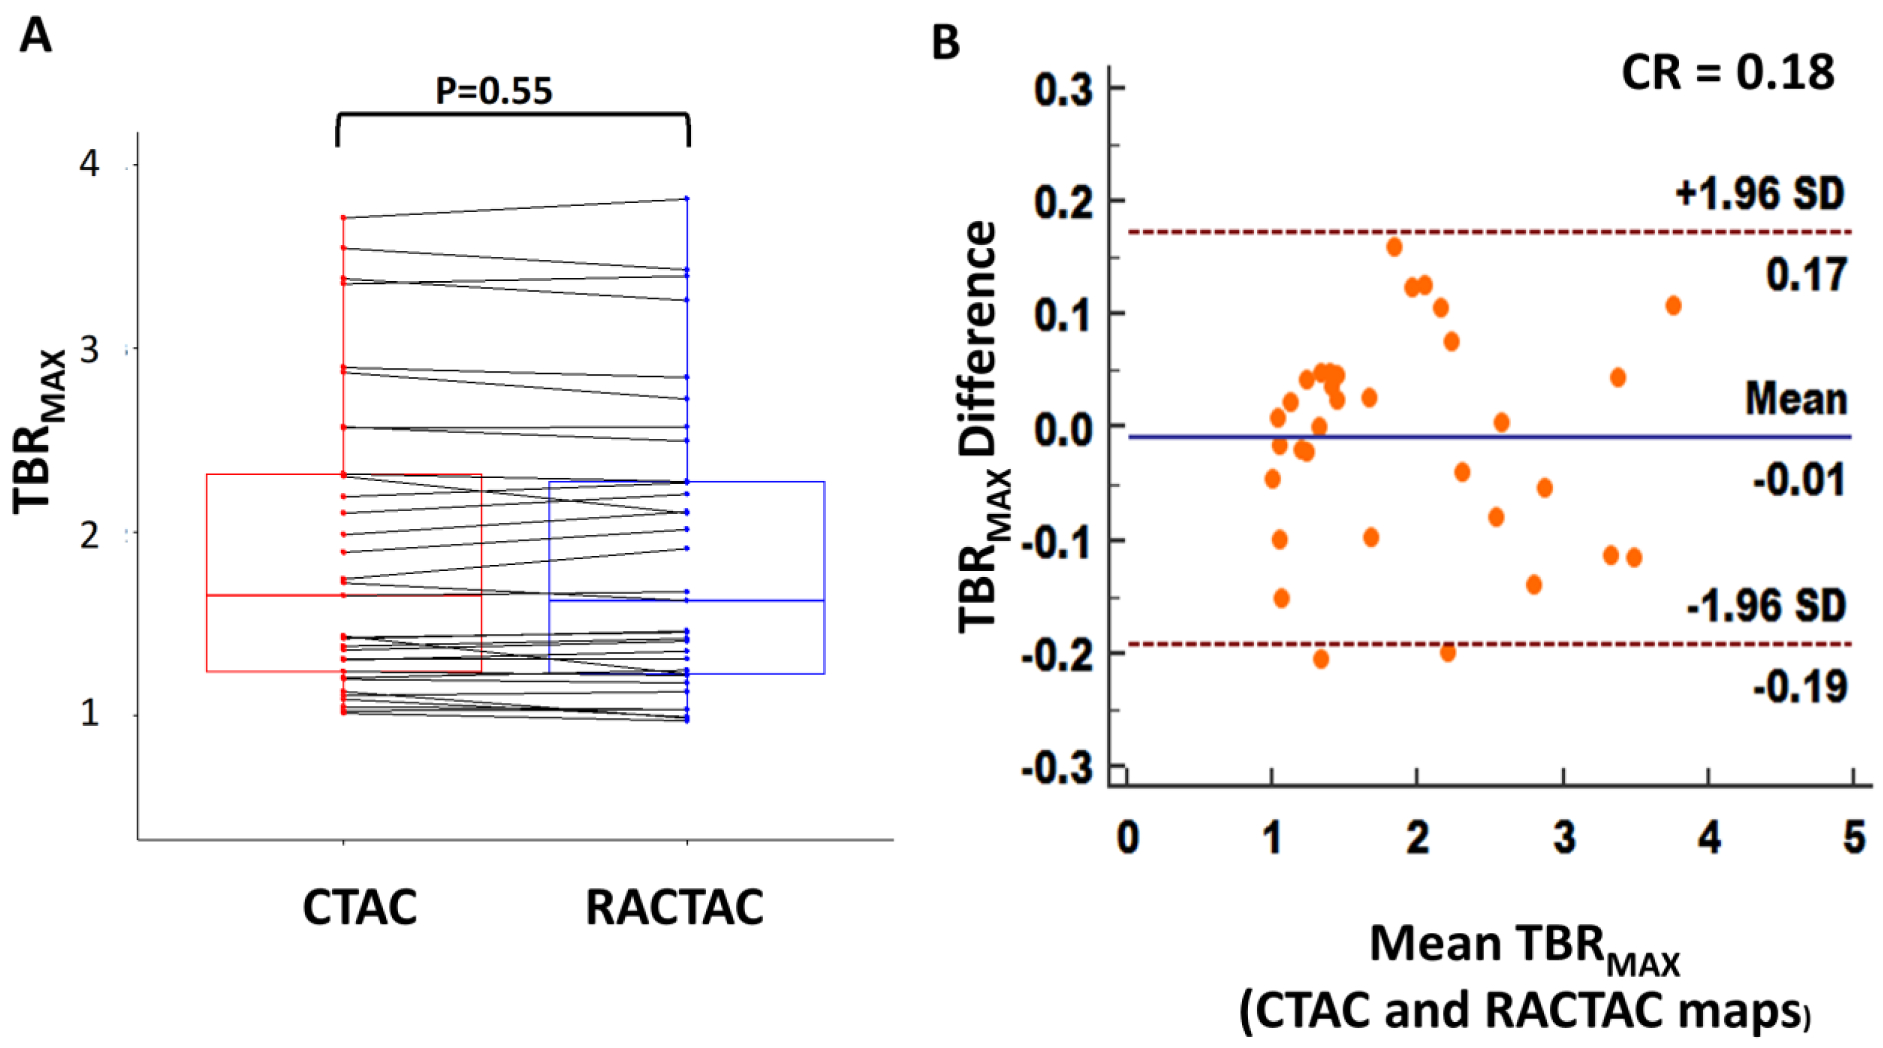
Figure 4.

A) Boxplot with connecting lines between the TBRmax measurements using the RACTAC maps vs CTAC maps (blue and red boxes represent interquartile range, with a thick solid line inside represents the median), B) Bland-Altman plot of the differences between the TBRmax measured using RACTAC maps vs CTAC maps.
TBRmax = maximum Target to background ratio, CTAC = Computed Tomography Attenuation Correction and RACTAC = Respiratory averaged computed tomography attenuation correction, CR = coefficient of reproducibility
