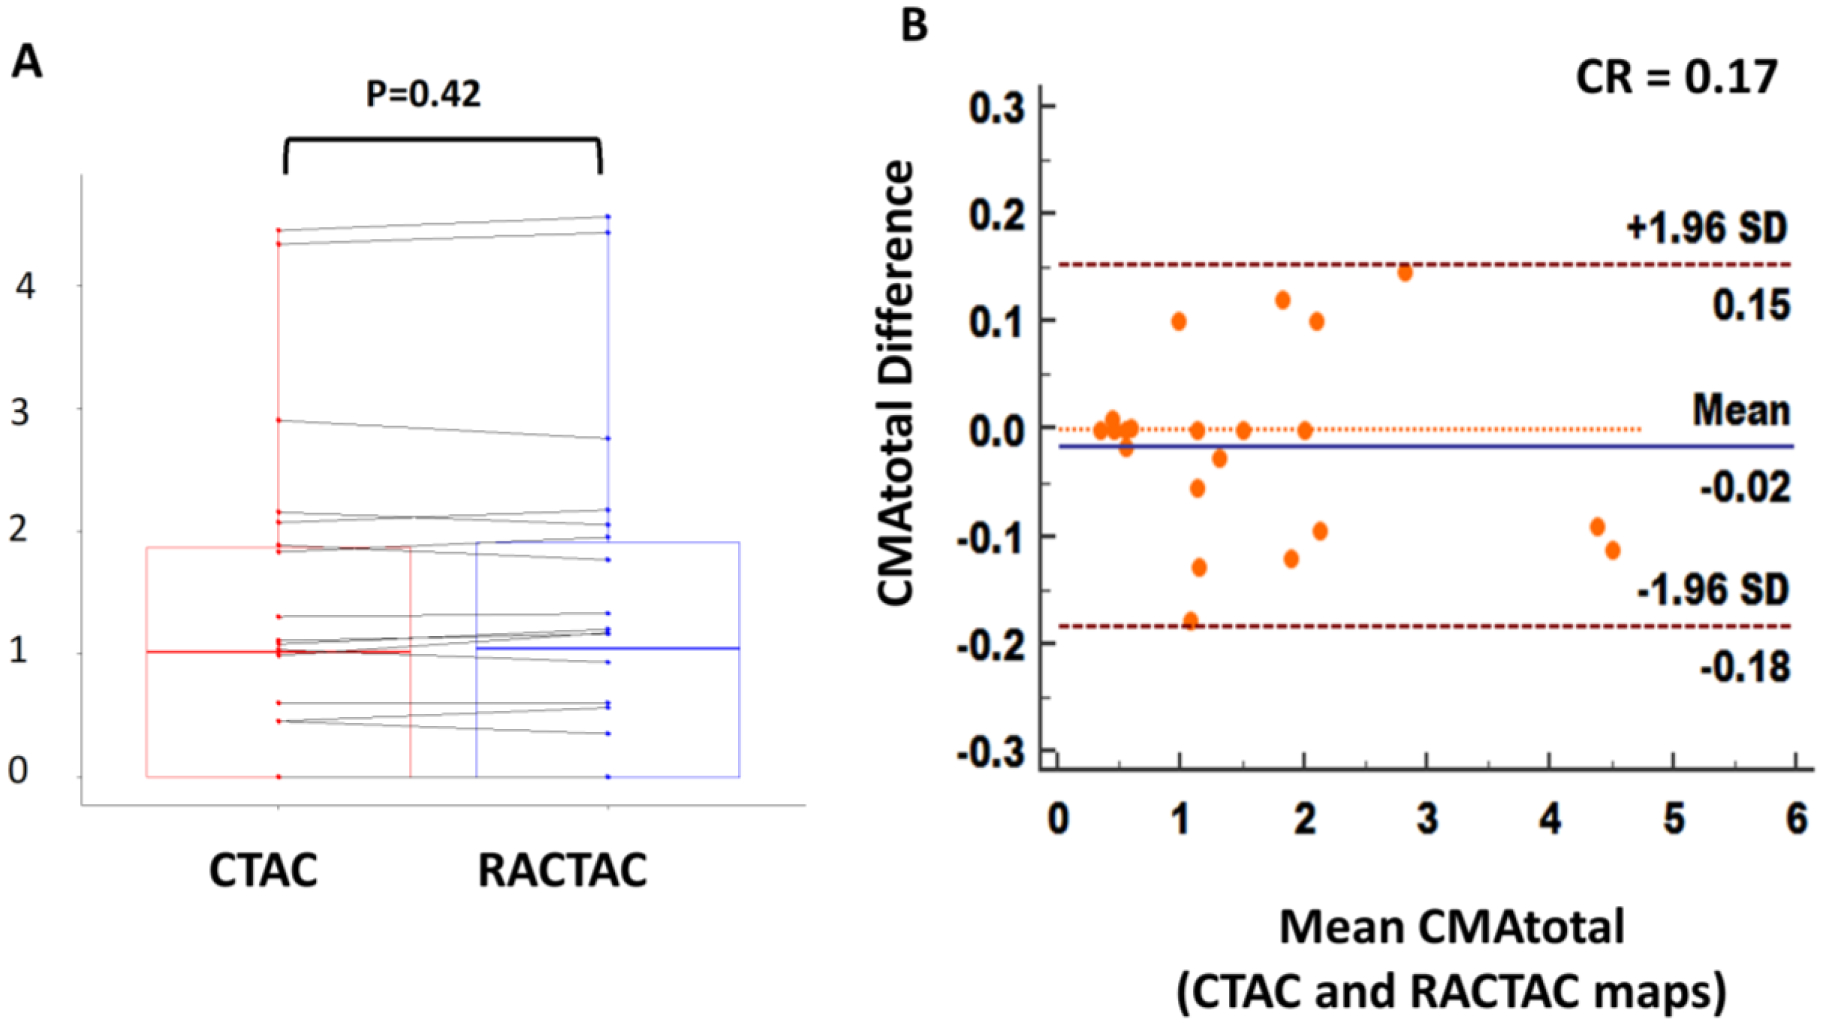
Figure 6.

A) Boxplot with connecting lines between the CMA total measurements using the RACTAC maps vs CTAC maps (blue and red boxes represent interquartile range, with thick solid line inside represents the median), B) Bland-Altman plot of the differences between the CMAtotal measured using RACTAC maps vs CTAC maps.
CMAtotal = whole coronary tree microcalcification activity, CTAC = Computed Tomography Attenuation Correction and RACTAC = Respiratory averaged computed tomography attenuation correction, CR = coefficient of reproducibility
