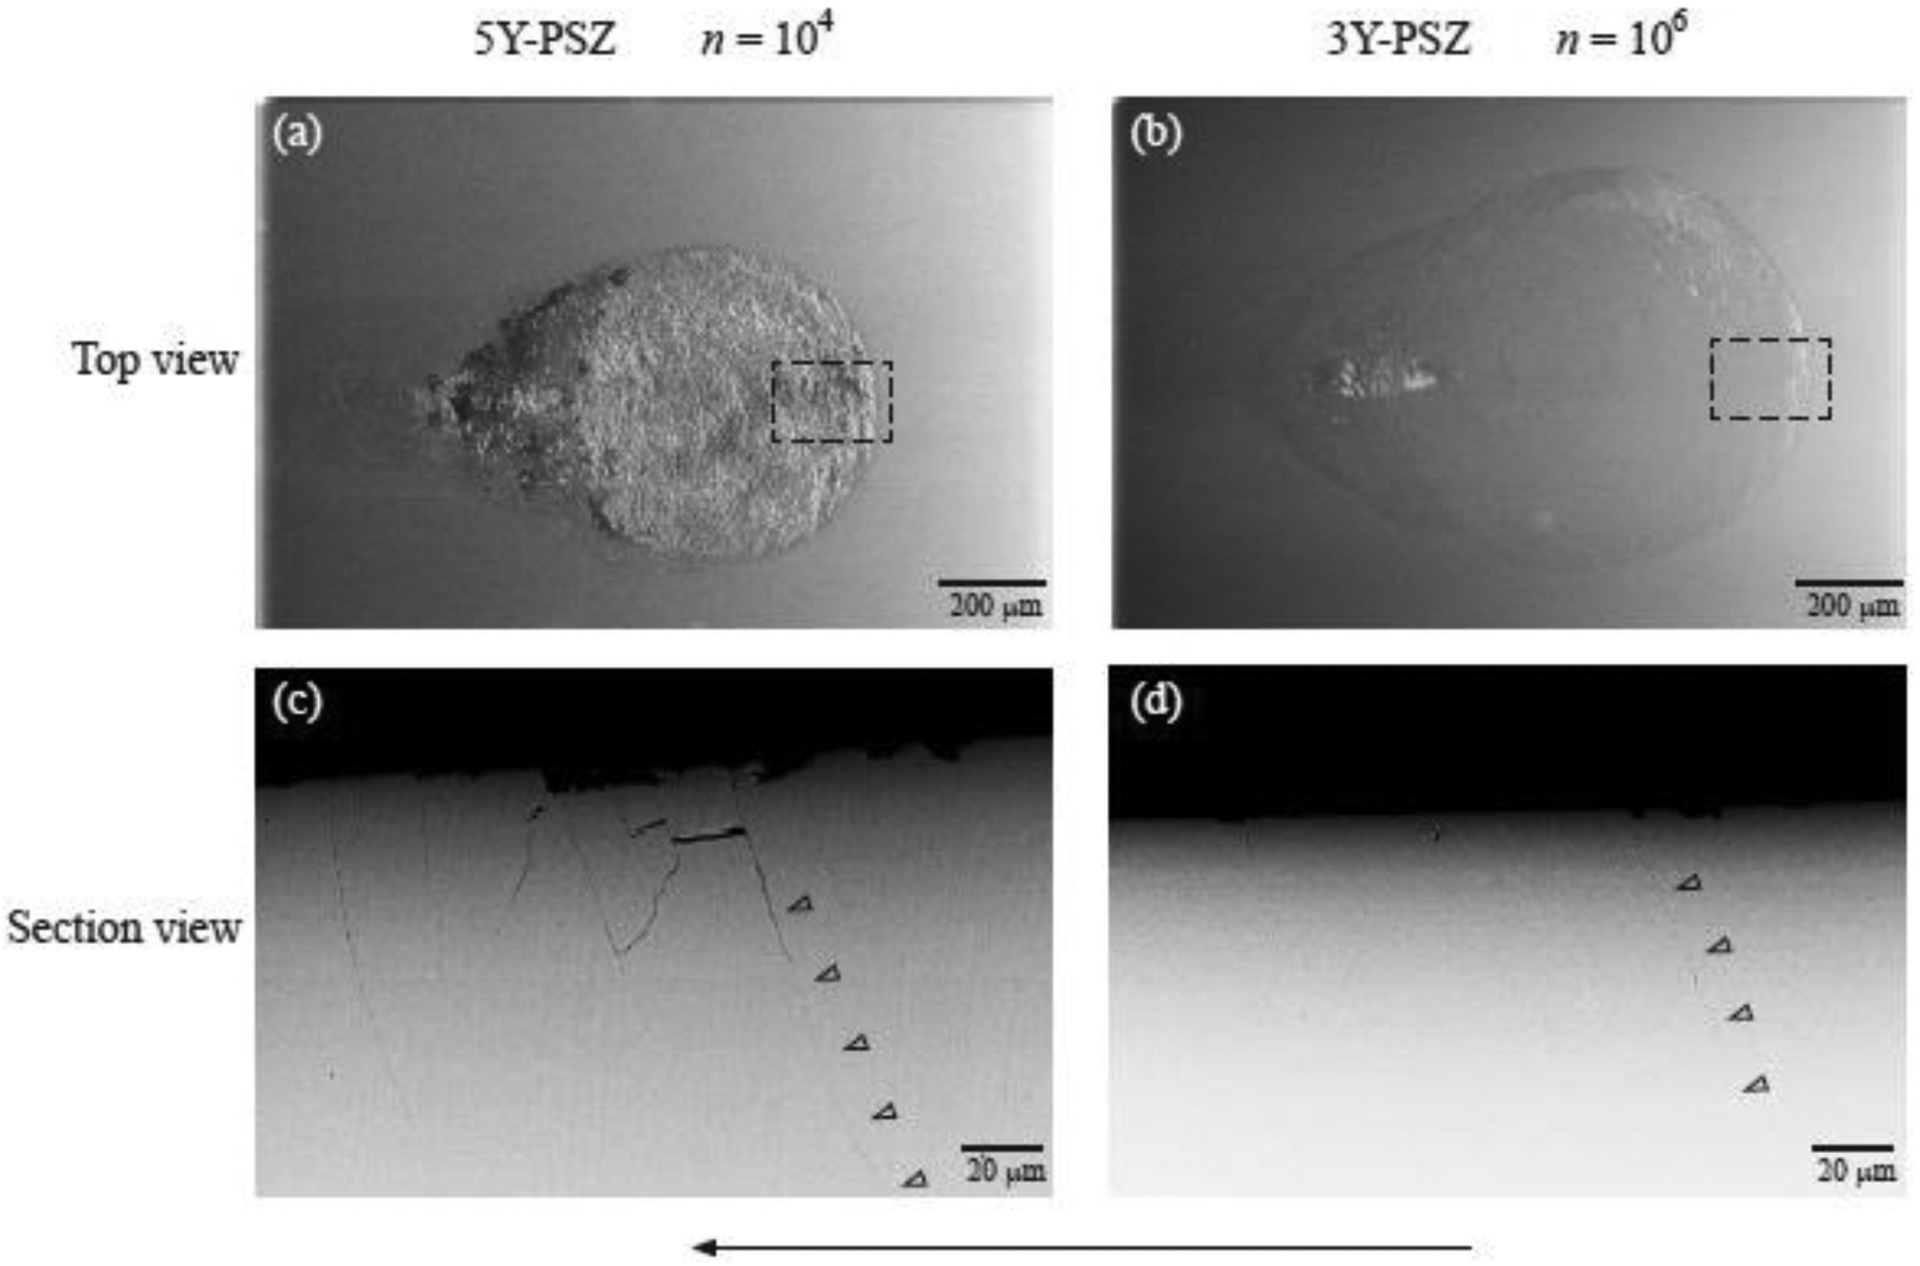
Figure 4.

Surface and sectional views of damage sustained in 5Y-PSZ and 3Y-PSZ following mouth-motion simulation at P = 200 N for n = 104 and 106 cycles, respectively. Surface views of the wear scars in (a) 5Y-PSZ and (b) 3Y-PSZ. Cross-sectional views of the area delimited by the dashed box showing partial cone cracks propagating from the surface to the interior of (c) 5Y-PSZ and (d) 3Y-PSZ. Note arrows in (c) and (d) highlight the trajectory of partial cone cracks. Sliding direction is from right to left. Images (a) and (b) were obtained with a pressure secondary electron detector (VPSE), whereas (c) and (d) were taken with a BSD (EHT 15 kV, and chamber pressure 99 Pa).
