
Fig. 5.
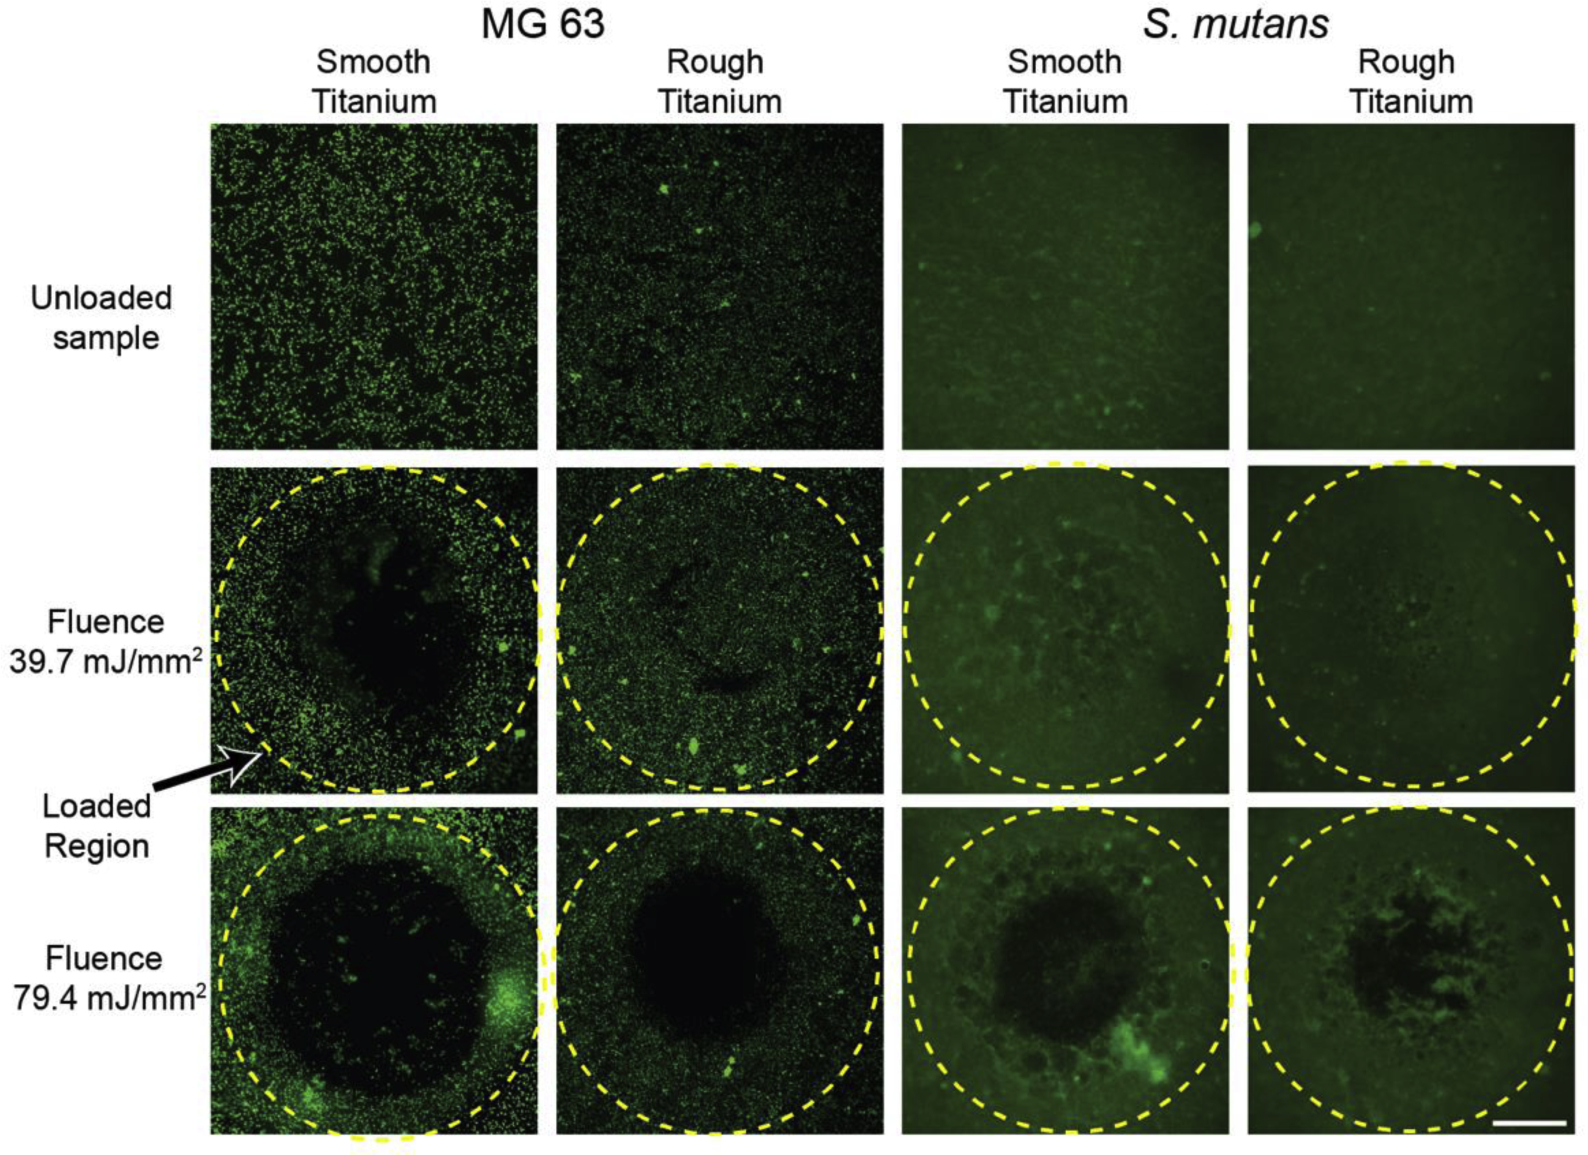
Fluorescence microscopy of MG 63 cell monolayers (first two columns from the left) and S. mutans biofilms (last two columns) of an unloaded region (first row from top), a loaded region at a fluence of 39.7 mJ/mm2 (second row), and a loaded region at a fluence of 79.4 mJ/mm2 (third row). Yellow dashed line indicates the loaded region, 2.2 mm diameter. MG 63 cell monolayers and S. mutans biofilms are stained with Calcein AM, and Syto 9, respectively. Scale bar is 0.5 mm.