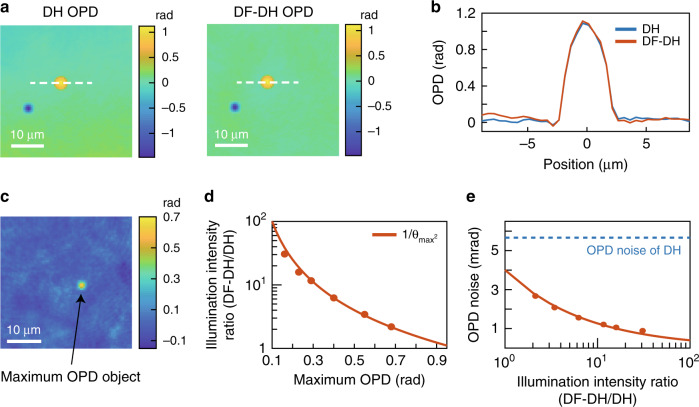
Fig. 2. Experimental validation of DF-DH.
a OPD images measured by DH (left) and DF-DH (right). b Cross-sectional profiles along the white dotted lines in (a). The blue and orange curves represent the results obtained by DH and DF-DH, respectively. c OPD image measured by DF-DH without the sample. An artificial object (indicated by the arrow) with the maximum OPD in the FOV (0.68 rad) is generated with the SLM. The area is used for the sensitivity evaluation. d Illumination intensity ratio of DF-DH and DH versus the maximum OPD value in the FOV. The data show good agreement with the theoretical curve (solid line). e OPD noise (standard deviation of temporal OPD) versus illumination intensity ratio of DF-DH and DH. The blue dotted line indicates the OPD noise of DH and is shown as a reference. The data show good agreement with the theoretical curve (solid line) described in Supplementary Information 2.3

