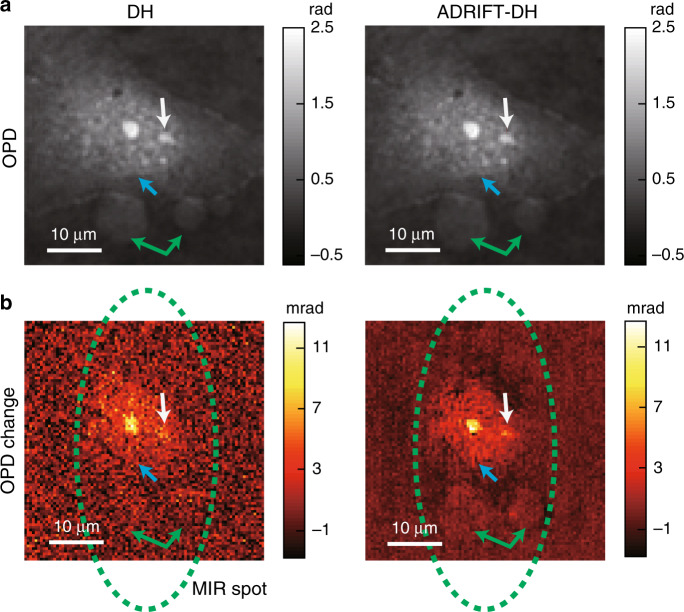
Fig. 5. Dynamic-range-expanded MIR photothermal QPI of a live COS7 cell.
a OPD images measured by DH (left) and ADRIFT-DH (right) in the MIR OFF state. The white, blue and green arrows show the existence of the nucleoli, nucleus and two particles, respectively. b Images of the photothermal OPD changes due to absorption of the MIR pump light measured by DH (left) and ADRIFT-DH (right). The area in the green dotted circle indicates the illumination spot of the MIR pump light. The structures indicated by the white (nucleoli), blue (nucleus) and green (particles) arrows in (a) also give stronger signals in the photothermal images shown in (b), which is visualized clearly with ADRIFT-DH but not with DH

