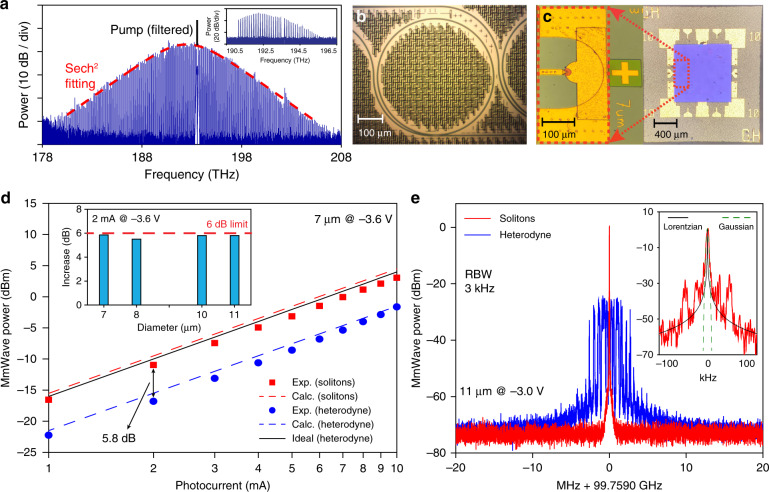
Fig. 3. Summary of featured experimental data of 100 GHz mmWave generation.
a Optical spectrum of the single soliton state from the microresonator. The spectrum has a Sech2 spectral envelope (fitting shown by the dashed red line). The pump laser is suppressed by a fibre-Bragg grating filter. The inset shows the optical spectrum of the soliton frequency comb after amplification and dispersion compensation. b Microscopic image of the integrated Si3N4 microresonator with a 100 GHz free-spectral range (FSR). c Microscopic images: front of photodiode die zoomed in on a single 7 μm device (left), and back of photodiode die flip-chip bonded to an aluminium nitride submount (right). d The 100 GHz mmWave output power measured for microresonator solitons (red) and optical heterodyne detection of two cw lasers (blue). The mmWave output power from the soliton is ∼5.8 dB more than that of heterodyne detection at the same photocurrent. Theoretical calculated powers from Eq. (1) are shown as dashed lines. In particular, the ideal output power from heterodyne detection is illustrated with a black solid line, which serves as a theoretical limit of heterodyne detection assuming no PD power roll-off at 100 GHz frequency. The inset shows the power increase obtained by using solitons over optical heterodyne detection on four devices with different diameters. e Down-converted electrical spectrum of a 100 GHz signal generated with free-running microresonator solitons (red). The inset shows the fitting with Lorentzian (black) and Gaussian (dashed green) lineshapes, and the corresponding 3-dB linewidths are 0.2 kHz and 4 kHz, respectively. As a comparison, the signal generated from the heterodyne method is shown in blue trace. The PD diameter and bias voltage are indicated in each panel

