
FIGURE 1.
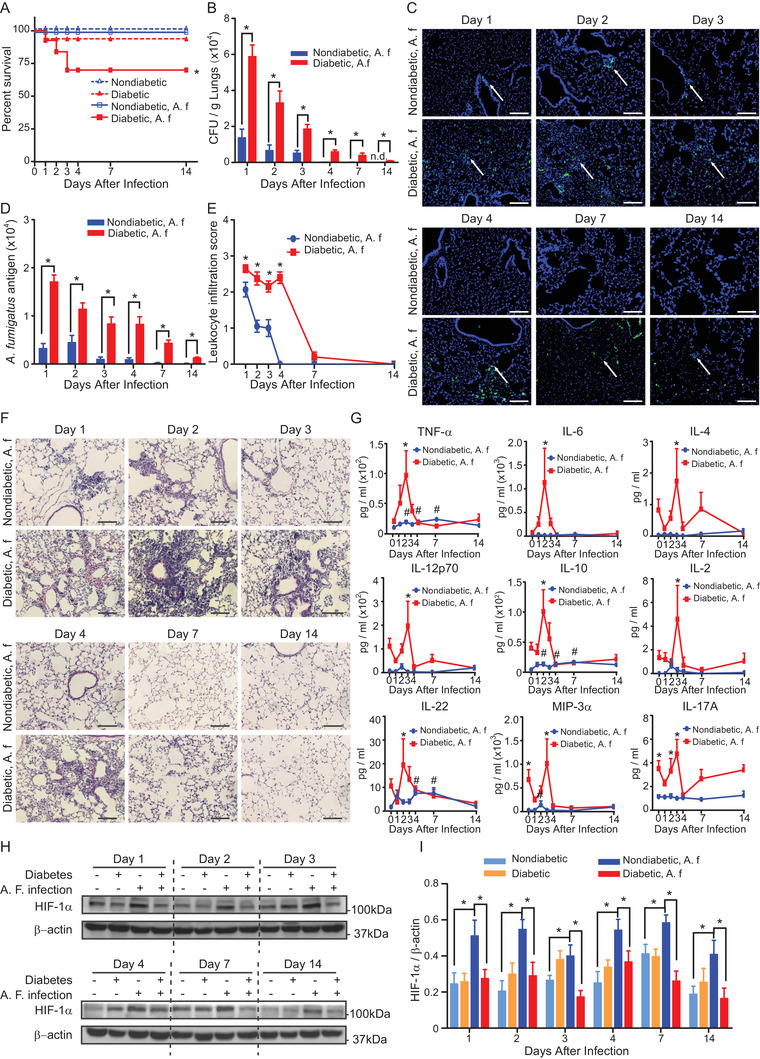
Diabetes reduces the survival rate and clearance of A. fumigatus, increases inflammatory responses and inhibits HIF‐1α induction in pulmonary A. fumigatus infection. Diabetic or nondiabetic mice were mock‐infected or received 5 × 10⁸ A. fumigatus conidia (A. f) intratracheally. A, Survival rate of the mice (n = 5, log‐rank test). B, Colony forming unit (CFU) counts per gram of lung tissue on indicated days post A. fumigatus challenge. N.d. denotes A. fumigatus was not detected (n = 5). C, Representative images of immunofluorescent staining of A. fumigatus (green) and DAPI (blue) in lung sections on indicated days post inoculation. Scale bars = 100µm. White arrows indicate positive staining of A. fumigatus conidia and hyphae. D, Quantification of the green fluorescence intensity of A. fumigatus (n = 5). B and D, *P < .05 analyzed using unpaired Student's t‐test. E, Quantification of leukocyte infiltration in panel F. F, Representative images of H&E staining of lung tissues harvested on indicated days post A. f inoculation. Scale bars = 100µm. G, Cytokine levels in serum on indicated days before (Day 0) and after A. fumigatus inoculation (n = 4 ‐ 5). E and G, *P < .05 compared between nondiabetic and diabetic groups analyzed using two‐way ANOVA followed by Bonferroni post‐hoc test. #, P < .05 compared with Day 0 in nondiabetic group using One‐way ANOVA followed by Fisher's LSD test. H, Representative images of HIF‐1α and β‐actin western blots. I, Quantification of HIF‐1α protein expression normalized to β‐actin (n = 5). *P < .05 analyzed for each day using RM One‐way ANOVA followed by Holm‐Sidak multiple comparisons test. Data are shown as mean ± SEM