FIGURE 1.

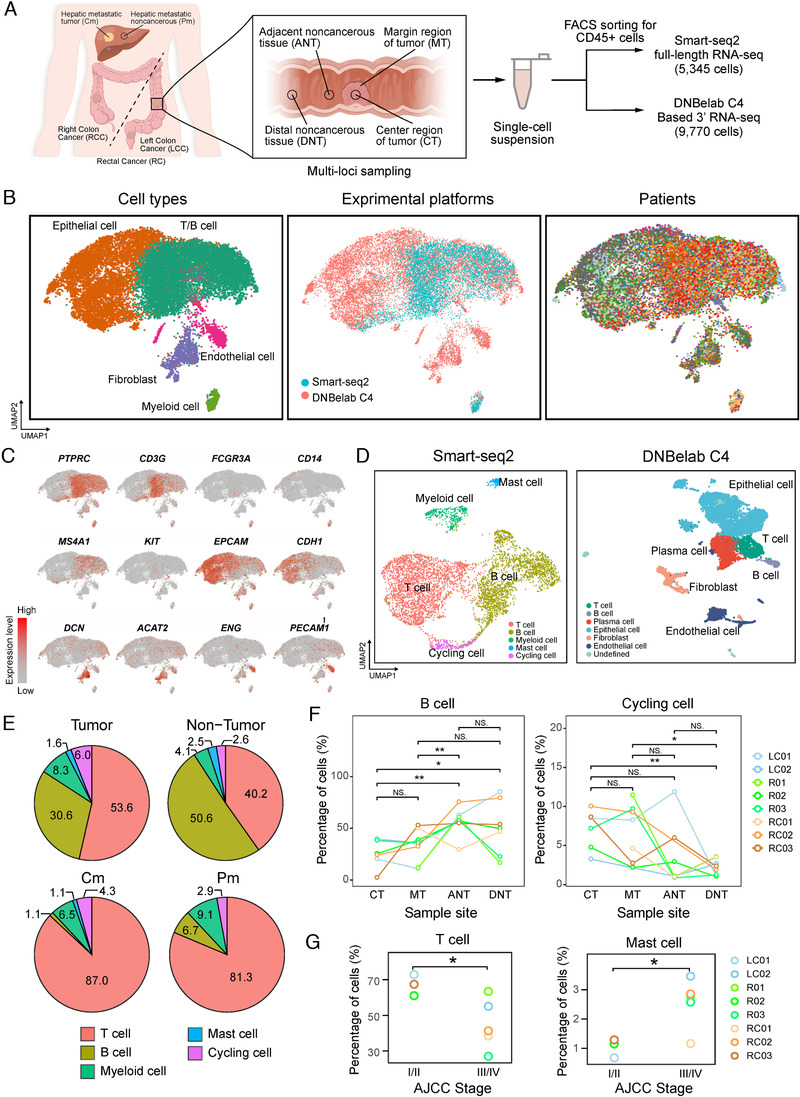
Overview of the immune landscape of colorectal adenocarcinoma (CRC) tumors and nontumor samples. A, Overview of the study design. Colon or rectum tumors and noncancerous samples were collected from 18 patients with CRC. B, Uniform Manifold Approximation and Projection algorithm (UMAP) plot of all cells form two experiment platforms profiled here. Each cell is color‐coded by (left to right): associated cell type, experiment platforms, and patient. C, UMAP plot, color‐coded for the expression level (gray to red) of marker genes in each cell type. D, UMAP plots show clustering results of different experimental platforms. E, Cell type distribution of tumor and nontumor tissues as well as paired hepatic metastatic tumor and nontumor tissues in discovery cohort. F, The percentage of B cells and cycling cells in different regions. G, Comparison of the cell distribution of T cells and mast cells and AJCC stage. NS, P > 0.05; *P < 0.05; **P < 0.01; ***P < 0.001, as determined by Student's t‐test.
