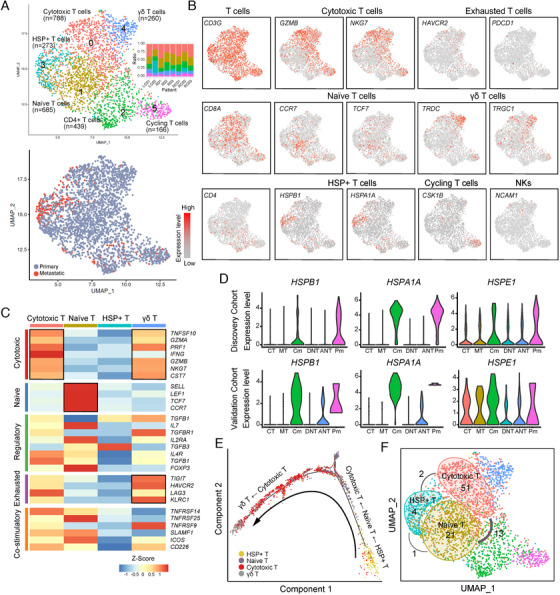
FIGURE 2.

Characterization of T‐cell subpopulations in colorectal adenocarcinoma (CRC). A, Uniform Manifold Approximation and Projection algorithm (UMAP) plot of 2,571 T cells, color‐coded by their associated cluster and bar plot shows distribution of cell clusters among patients (top) or sample type (bottom). B, UMAP plot, color‐coded for the expression level (gray to red) of marker genes in each cell type. C, Heatmap showing the z‐score of T‐cell functional genes for each cluster. D, The expression level of heat‐shockprotein (HSP) genes in discovery cohort and validation cohort. E, The ordering of T cells along pseudotime in a two‐dimensional state‐space defined by Monocle2. Each point corresponds to a single cell, and each color represents a T‐cell cluster. F, Clone expansion and sharing among naïve, cytotoxic, and HSP+ T cells. The number within the circle refers to the expansion clone number in that specific cluster. Lines connecting clusters are based on the degree of TCR sharing, with the thickness of the line representing the number of shared TCR clones.
