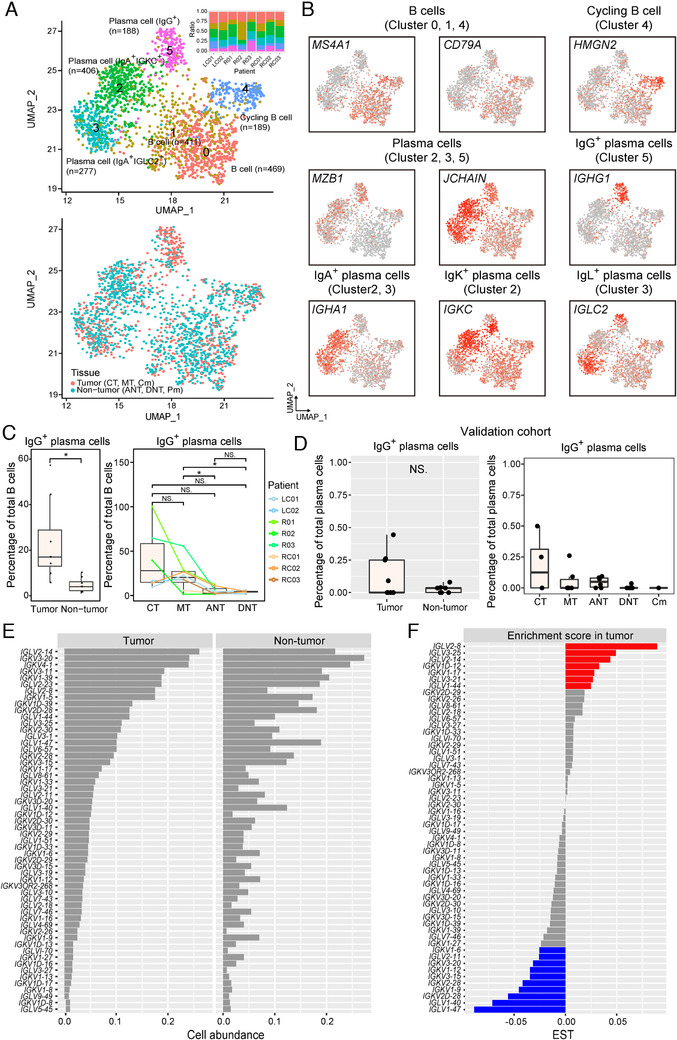
FIGURE 4.

A distinctive landscape of B‐cell subpopulations in colorectal adenocarcinoma (CRC). A, Uniform Manifold Approximation and Projection algorithm (UMAP) plot of 1940 B cells, color‐coded by their associated cluster and bar plot shows distribution of cell clusters among patients (top) or sample tissue origin (bottom). B, UMAP plot, color‐coded for the expression level (gray to red) of marker genes in each cell type. C, The percentage of IgG plasma cells in tumor and nontumor tissues. D, The percentage of IgG plasma cells in tumor and nontumor tissues from validation cohort. E, Frequency of B cells expressing immunoglobulin (Ig) light chain variable genes in B‐cell population. Only 56 genes having expression across 20 B cells (1%) were selected to compare the frequency between tumor and nontumor region. F, The calculated enrichment score in tumor of 56 light chain variable genes in (E). Enrichment score in tumor = [frequency in tumor region] − [frequency in nontumor region]. NS, P > 0.05; *P < 0.05; **P < 0.01; ***P <0 .001, as determined by Student's t‐test.
