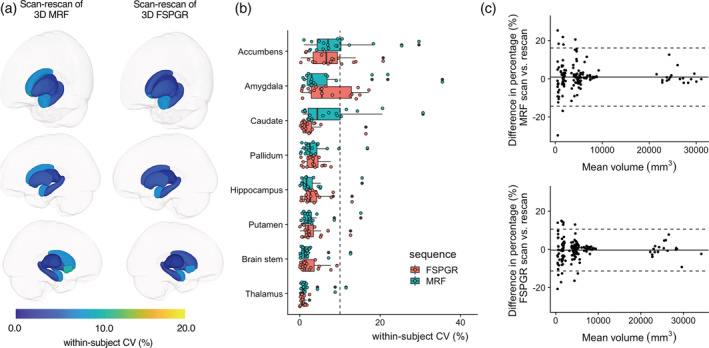
FIGURE 5.

Scan‐rescan repeatability of subcortical volumes for 3D MRF and 3D FSPGR. (a) Scan‐rescan within‐subject coefficient of variation (wCV) among scans is overlaid on an inflated brain surface for 3D MRF and 3D FSPGR. (b) Scan‐rescan wCV of subcortical volumes for 3D MRF and FSPGR (Boxes indicate the interquartile range [25–75%] and circles indicate sample data points). (c) Bland–Altman plots of the scan‐rescan variation in subcortical structure volumes across all subjects in all structures using (top) 3D MRF and (bottom) 3D FSPGR
