
FIGURE 2.
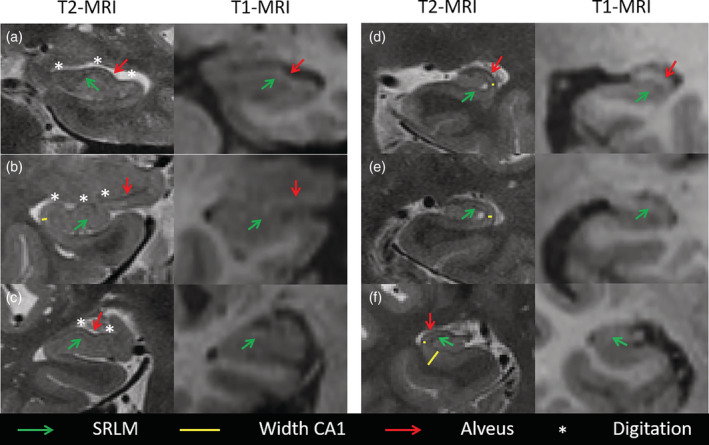
Comparison of 0.4 × 0.4 × 2.6 mm3 T2‐ and 1 × 1 × 1 mm3 T1‐weighted MRI in the same subjects demonstrating better visualization of the inner structure of the hippocampus on 0.4 × 0.4 × 2.6 mm3 T2‐weighted MRI; a and d‐f are cognitively normal (CN) older adults and b‐c are patients with Mild Cognitive Impairment (MCI). The green arrows point out the hypointense band stratum radiatum lacunosum moleculare (SRLM) which can be observed on the high‐resolution T2‐weighted MRI scans but not on the 1 mm3 isotropic T1‐weighted MRI scans. The visualization of SRLM allows for accurate depiction of the width of cornu ammonis (CA) as indicated by the yellow lines in T2‐weighted MRI but not on T1‐weighted MRI. Similarly, the high resolution and the depiction of SRLM and alveus (outer hypointense band, red arrows) in the T2‐weighted MRI, but not T1‐weighted MRI, allow for clear visualization of the digitations (white asterisks) in the hippocampal head, which is crucial for accurate segmentation. Note that the alveus is visible as a hyperintense band on T1‐weighted MRI but is less sharp than on the T2‐weighted MRI