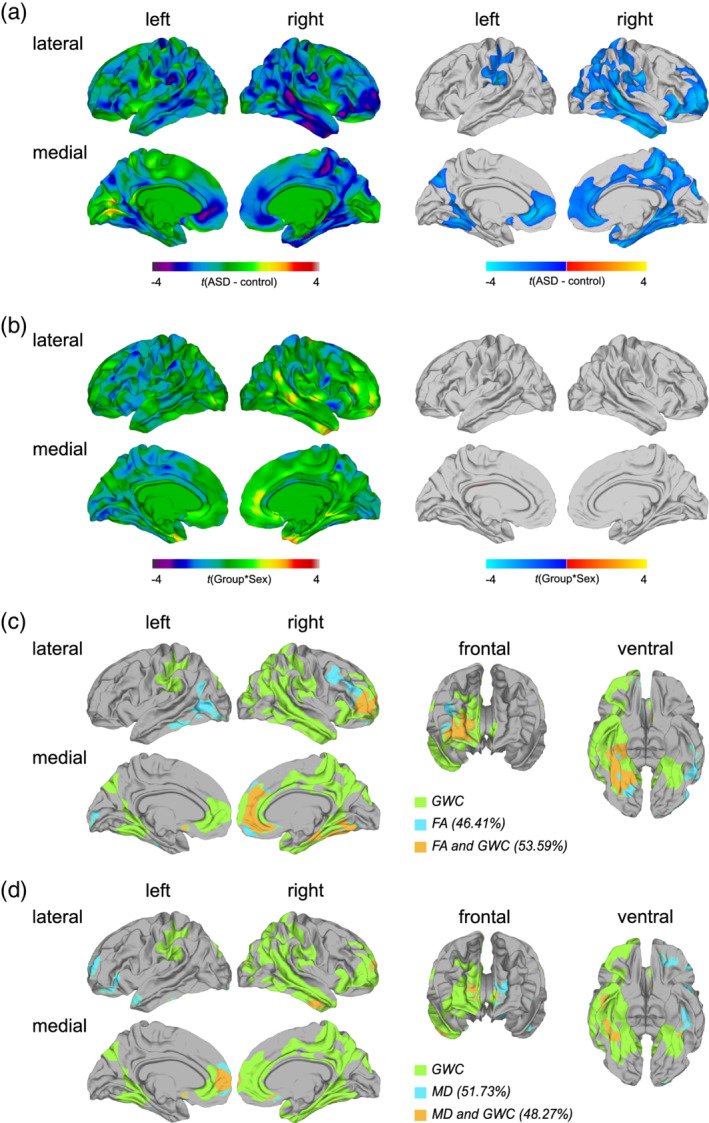
FIGURE 3.

Main effect of group and group‐by‐sex interaction effects for the gray‐white matter tissue contrast (GWC), and the overlap between the patterns of between‐group differences in GWC and diffusion measures. (a) Regions of significantly reduced GWC in individuals with autism spectrum disorder (ASD) compared to typically developing (TD) controls sampled as ratio between the gray matter signal intensity sampled 30% into the thickness of the cortical ribbon from the gray‐white matter (GWM) boundary and white matter signal intensity sampled −1 mm below the GWM boundary (random field theory [RFT]‐based cluster corrected p < .05, two‐tailed). (b) Regions with a significant group‐by‐sex interaction effect for GWC. Displayed are the unthresholded (left panel) and thresholded (right panel) t‐maps (RFT‐based cluster corrected p < .05, two‐tailed). (c) As well as percentages of spatial overlap between the patterns of between‐group differences in GWC with fractional anisotropy (FA) and (d) with mean diffusivity (MD), both sampled vertex‐wise at the GWM boundary
