
FIGURE 5.
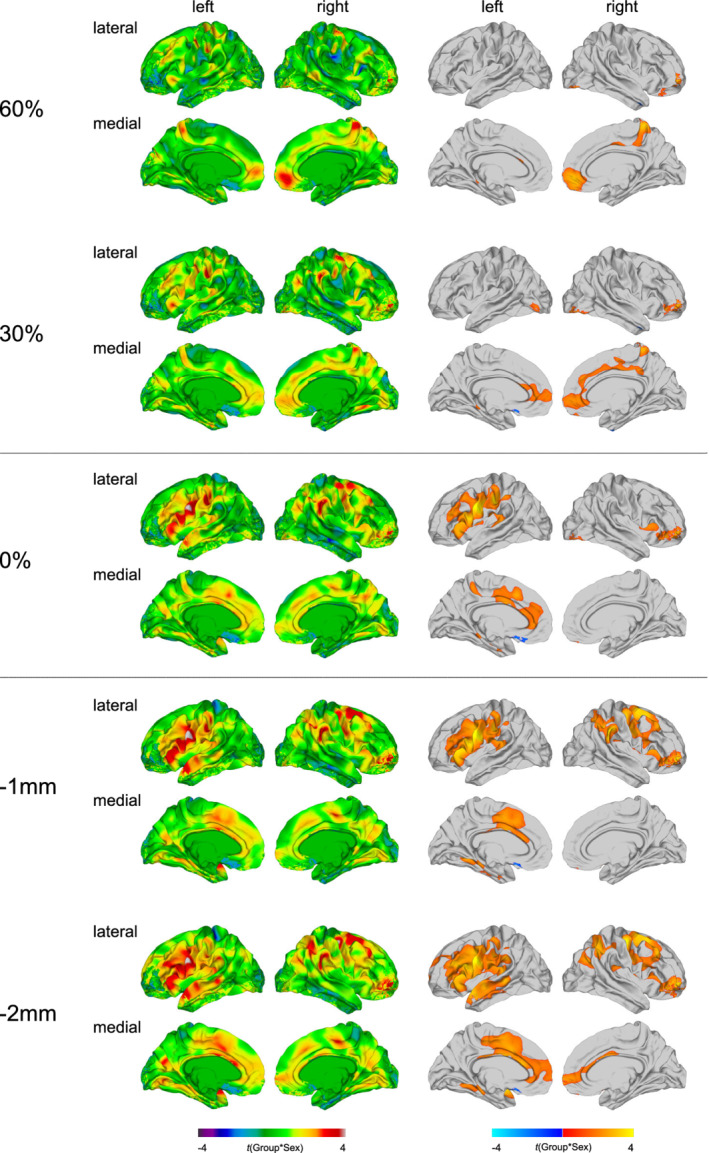
Group‐by‐sex interaction effects for mean diffusivity (MD). Regions with a significant group‐by‐sex interaction effect for MD at the gray‐white matter (GWM) boundary (0%), at different cortical thickness (CT) projection fractions within the gray matter (i.e., 30 and 60% CT, sampled from the GWM boundary into the thickness of the cortical ribbon), and within the superficial white matter (sampled at absolute distances of −1 and −2 mm below the GWM boundary). Displayed are the unthresholded (left panel) and thresholded (right panel) t‐maps (random field theory [RFT]‐based cluster corrected p < .05, two‐tailed)