
FIGURE 3.
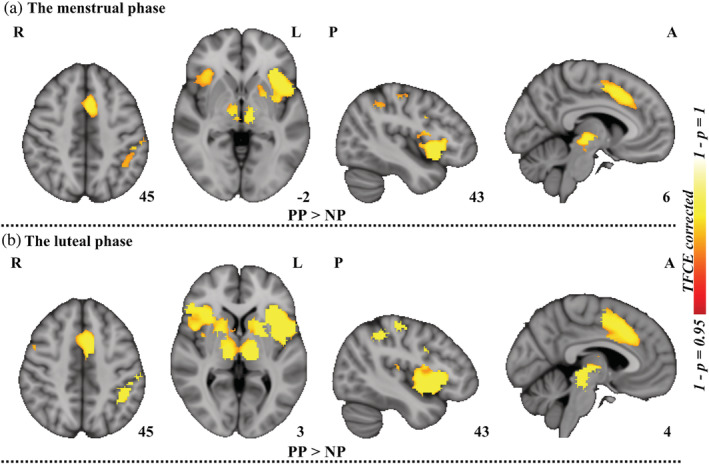
Between‐picture differences in brain activation. (a) Significant brain areas, from task activation comparisons conducted on viewing neutral pictures versus pain pictures, for all of the subjects during the menstrual phase. (b) Significant brain areas, from task activation comparisons conducted on viewing pain pictures versus neutral pictures, for all of the subjects during the luteal phase. Permutation test (permuted 5,000 times) with threshold‐free cluster enhancement (TFCE) was utilized for multiple comparison corrections. NP, neutral pictures; PP, pain pictures; L, left; R, right; A, anterior; P, posterior