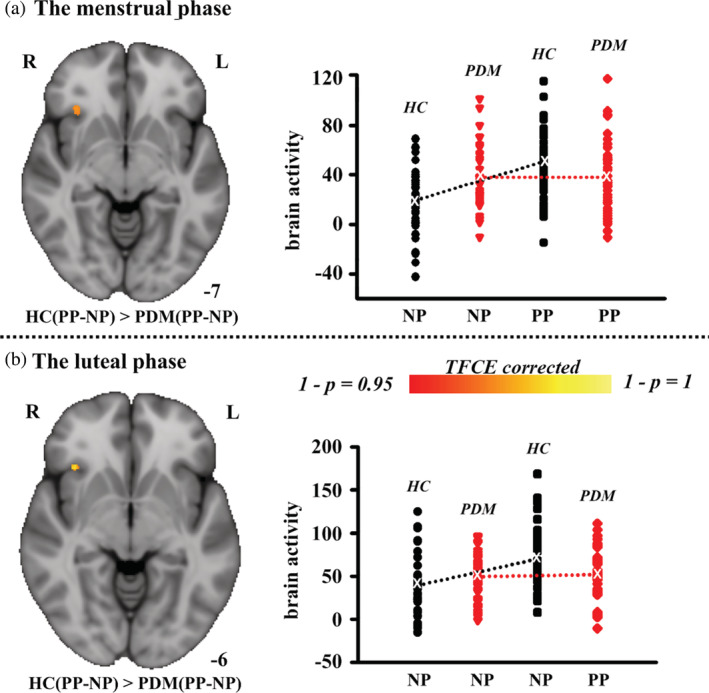
FIGURE 4.

Between‐group differences in brain activation in response to visual stimuli. (a) Brain areas that were significantly more active in HC subjects than in PDM subjects while viewing pain pictures relative to neutral pictures (there were no regions that were significantly more active in PDM subjects than in HC subjects) during the menstrual phase. The average value for the contrast of parameter estimates, corresponding to brain activity in response to different types of visual stimuli of each subject, is plotted for the cluster representing the interaction effect (group × picture). (b) Brain areas that were significantly more active in HC subjects than in PDM subjects while viewing pain pictures relative to neutral pictures (there were no regions that were significantly more active in PDM subjects than in HC subjects) during the luteal phase. The average value for the contrast of parameter estimates, corresponding to brain activity in response to different types of visual stimuli of each subject, is plotted for the cluster representing the interaction effect (group × picture). A permutation test (permuted 5,000 times) with a TFCE was utilized for multiple comparison corrections. HC, healthy controls; PDM, women with primary dysmenorrhea; NP, neutral pictures; PP, pain pictures; L, left; R, right
