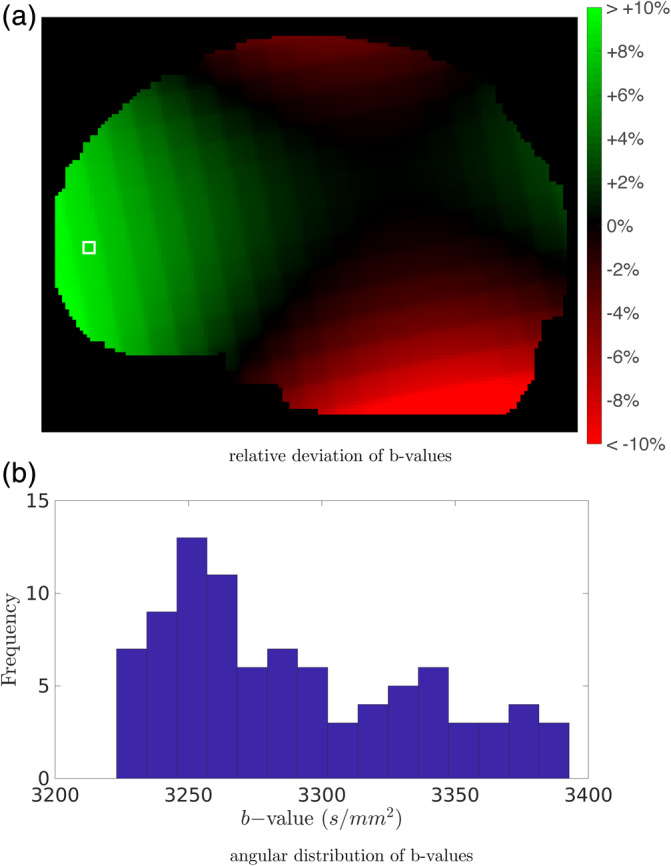
FIGURE 2.

Deviations of the b‐value due to gradient nonlinearities in data set 2: (a) deviation as a function of position (averaged across directions), and (b) distribution of b‐values in a b = 3,000 s/mm2 shell (within a single voxel, delineated by the white square in (a))
