
FIGURE 4.
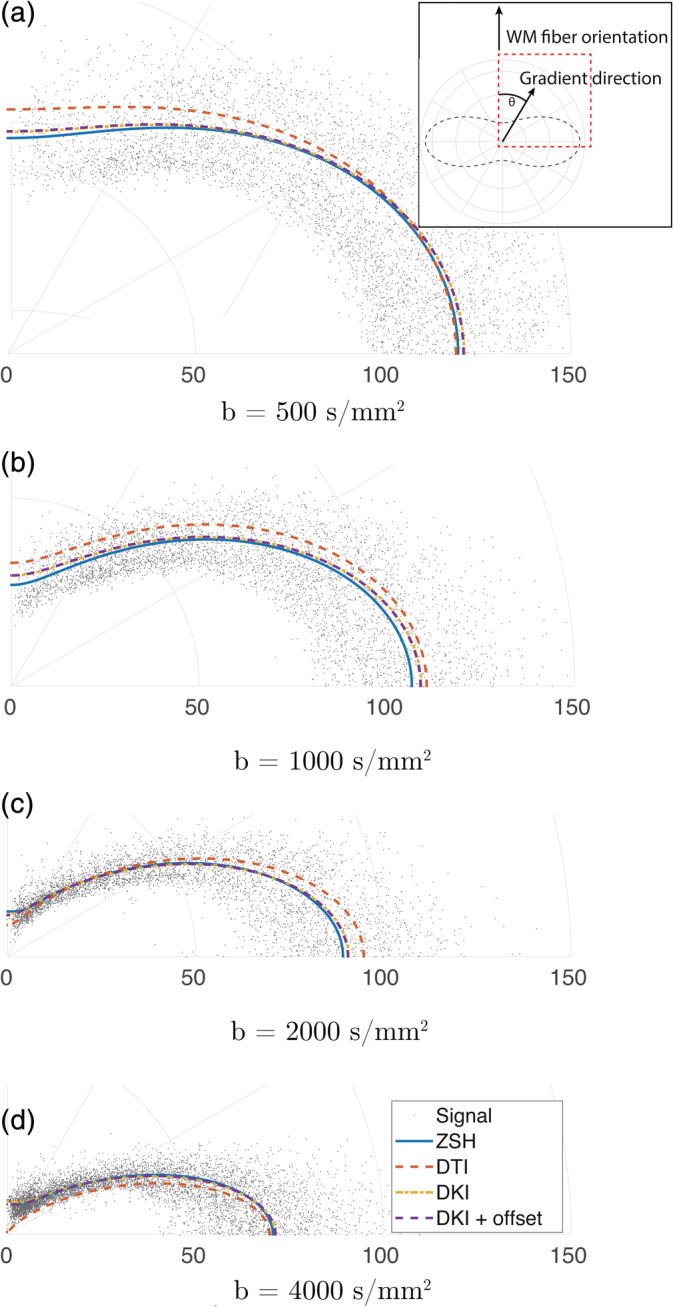
Comparison of the angular component of the white matter (WM) response predicted by the candidate models and the zonal spherical harmonics (ZSH) model using spherically sampled data, at different b‐values. The polar angle θ corresponds with the angle between the b‐vector and the z‐axis. The data points are the measured signals for the ensemble of WM voxels with their principal eigenvector aligned with the z − axis (or equivalently the θ = 0 axis)