
FIGURE 10.
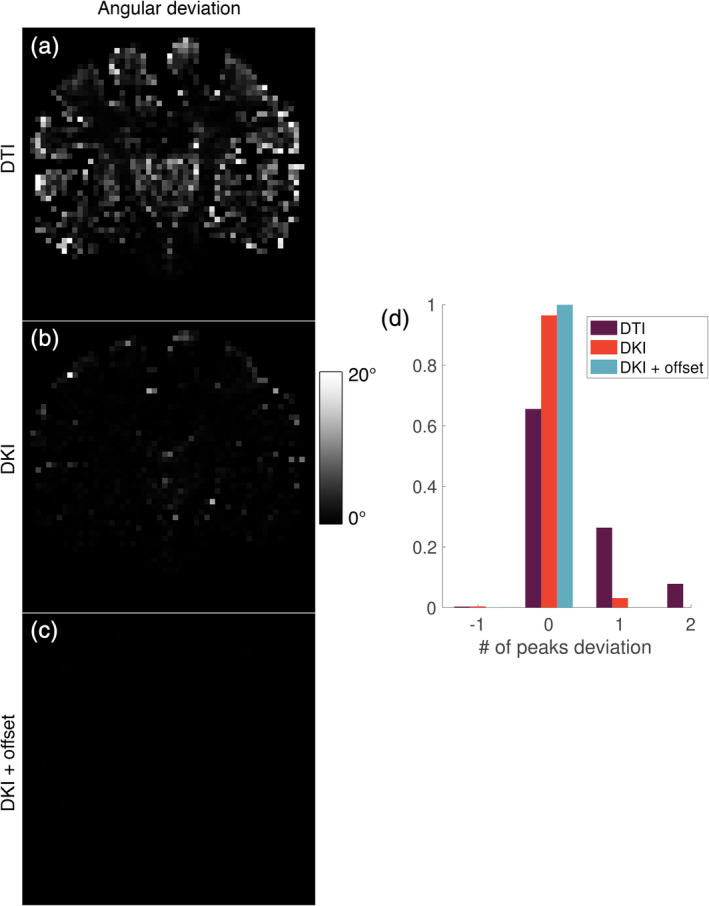
(a–c) Deviation of the amount of fiber orientation density function (fODF) peaks obtained with the candidate response models from those obtained with the zonal spherical harmonics (ZSH) model and (d) distribution of the deviations depicted in Figure 10a–c