
FIGURE 11.
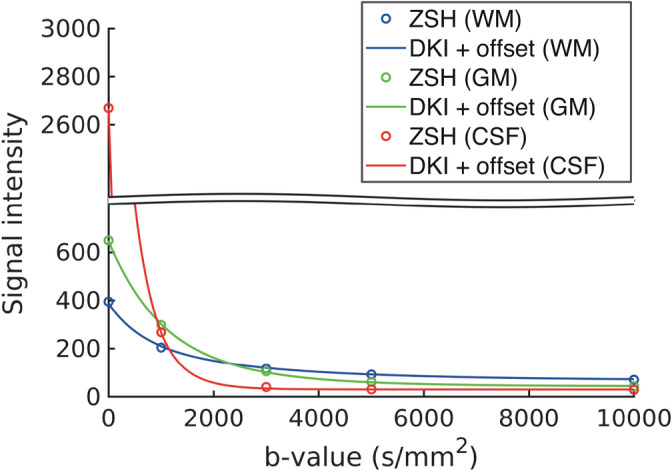
Generalizability to high b‐values: comparison of the radial component of tissue responses predicted by the diffusion kurtosis imaging (DKI) + offset model and those predicted by the zonal spherical harmonics (ZSH) for data set 3 with b‐values up to b = 10,000 s/mm2