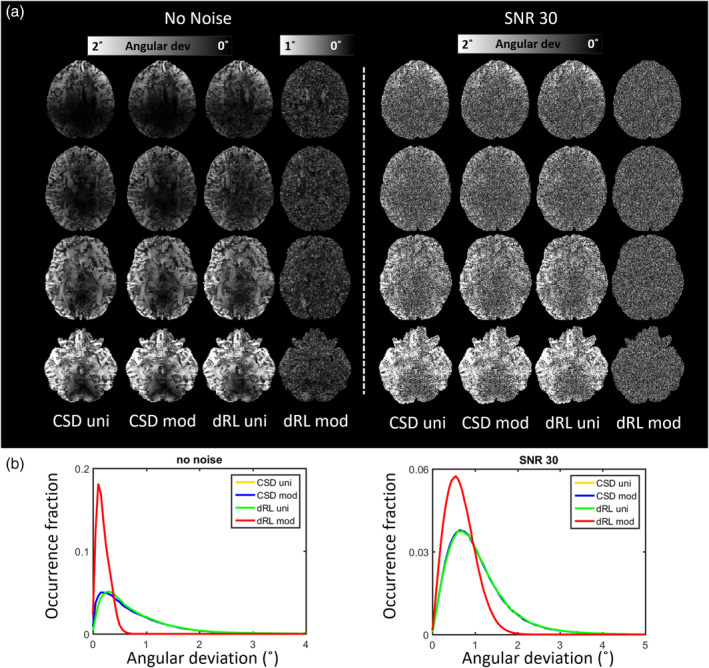
FIGURE 5.

(a) The angular deviation map of the primary fiber orientation distribution (FOD) peak through damped Richardson‐Lucy (dRL)‐uni, dRL‐mod, constrained spherical deconvolution (CSD)‐uni, and CSD‐mod estimation of the synthetic brain from an axial view. (b) The distribution of angular deviations between the estimated primary FOD peak and the simulated fiber orientations. Notice that the yellow lines and green lines are overlapping. CSD (blue and yellow lines) and dRL‐uni (green lines) are close in performance. The angular deviations can reach over 2° toward the edges of the synthetic brain. Using the dRL‐mod FOD estimation (red lines) reduces the angular deviations to within 1° with a medium value of around 0.2°
