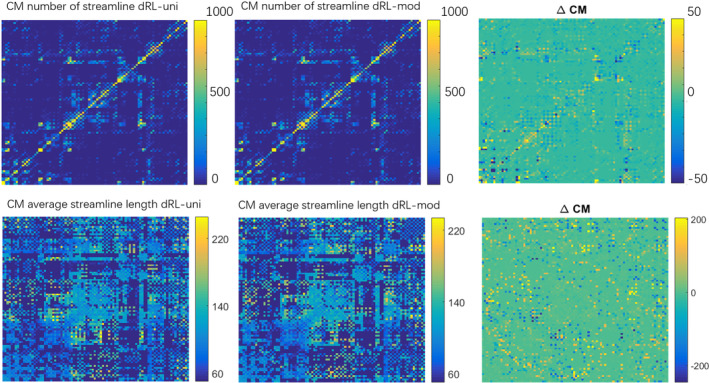
FIGURE 7.

The connectivity matrix (CM) derived from the fiber tractography reconstructed from damped Richardson‐Lucy (dRL)‐uni fiber orientation distributions (FODs) and dRL‐mod FODs, and the differences between dRL‐uni CM and dRL‐mod CM shown in the right column marked as ΔCM. Bright yellow and dark blue areas indicate large differences in the CMs
