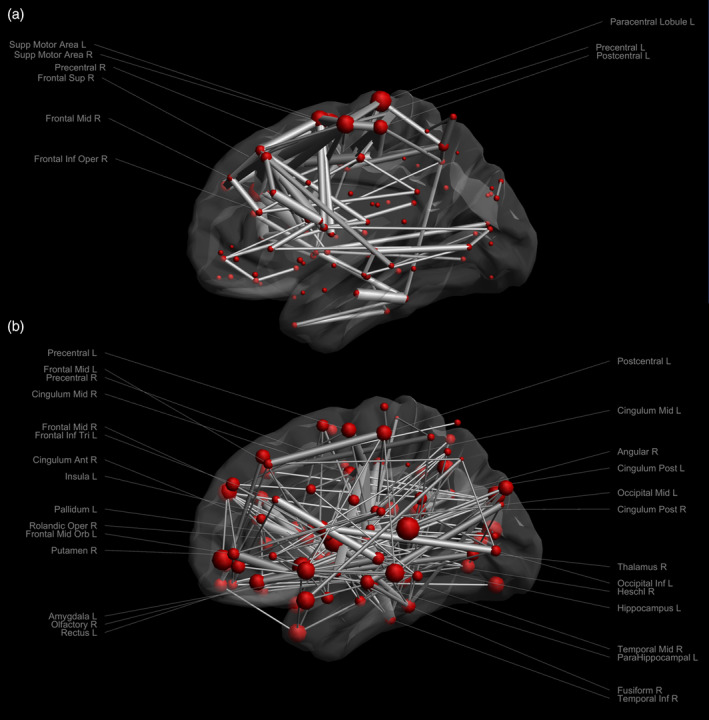
FIGURE 8.

The connectivity matrix (ΔCM) of (a) streamline counts and (b) streamline length. The nodes are scaled according to the total ΔCM to every other region. The edges are scaled according to differences, thresholded as being larger than 20 in streamline counts and between 10 and 30 in streamline length. The labels of areas with an edge threshold larger than 100 in streamline counts and an edge threshold of 25–30 in streamline length are shown
