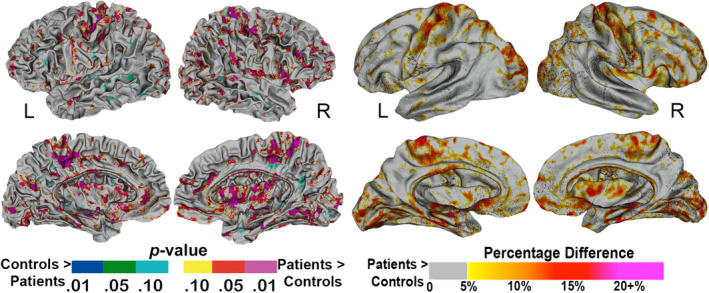
FIGURE 2.

Vertex‐based differences in the superficial white matter between controls and MSA patients. Color maps represent level of significance (p values) on the left, and percentage difference on the right. Results are uncorrected for multiple comparisons. MSA, multiple system atrophy
