FIGURE 3.

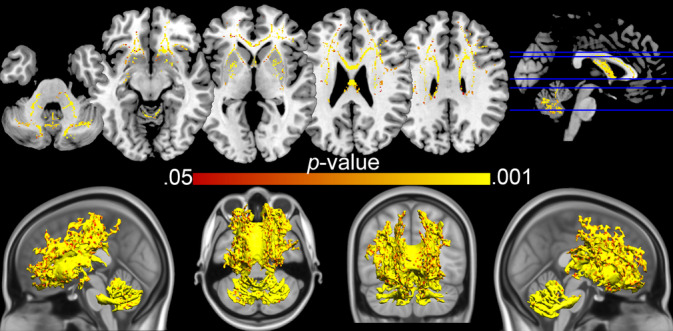
TBSS results—MSA versus healthy controls. Clusters shown are all p < .05 (Threshold‐free cluster enhancement corrected). MSA, multiple system atrophy; TBSS, tract‐based spatial statistics

TBSS results—MSA versus healthy controls. Clusters shown are all p < .05 (Threshold‐free cluster enhancement corrected). MSA, multiple system atrophy; TBSS, tract‐based spatial statistics