
FIGURE 1.
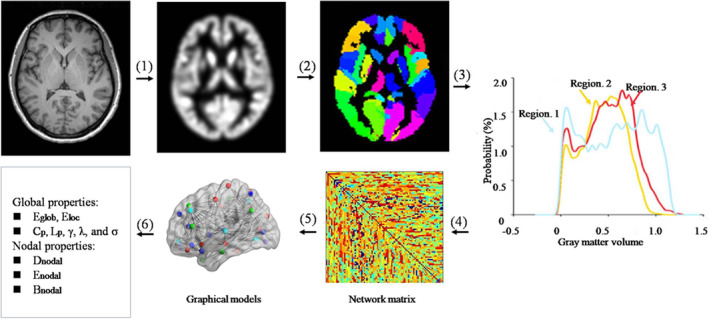
A flowchart for the construction of gray matter (GM) morphological networks using T1‐weighted MRI. (1) Individual structural images were segmented, normalized, modulated, and smoothed using a routine VBM procedure to obtain the GM maps. (2) The GM map was divided into 90 regions according to the AAL atlases. (3) For each region, its GM volume was extracted and used to estimate the PDF (4) The KLS between the PDFs of each pair of regions was calculated, resulting in a similarity matrix. (5) Individual brain networks were represented as graphs. (6) Finally, the network properties were calculated at both the global and nodal levels