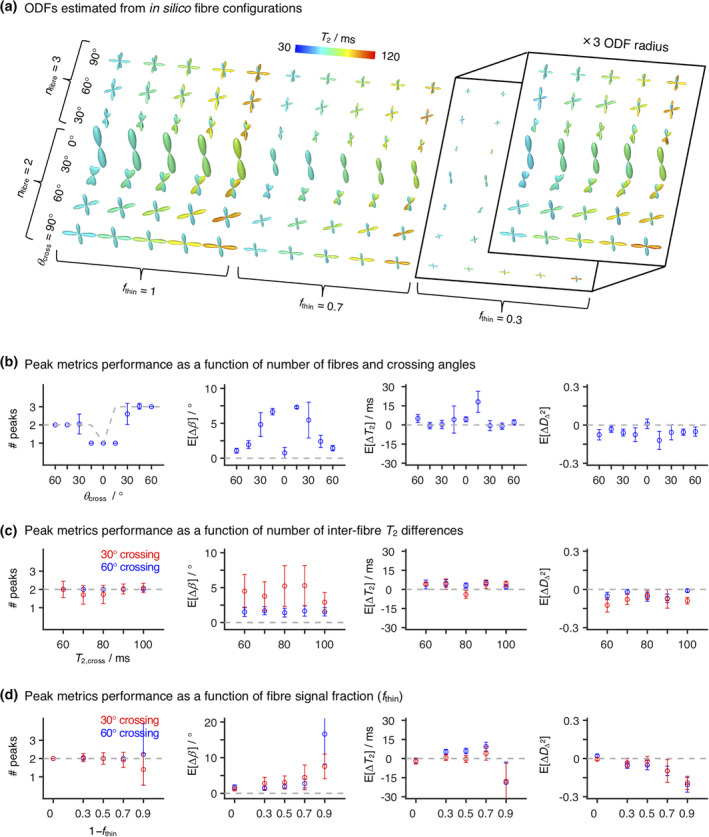
FIGURE 3.

Orientation Distribution Functions (ODF) and peak metrics retrieved for in silico fibre‐crossing datasets. (a) ODF glyphs computed for the in silico systems described in Section 2.6. The displayed ODFs are coloured according to the orientation‐resolved means of T 2, Ê[T 2] (see Equation (9) for more details). The inset displays the f thin = 0.3 ODFs with their base amplitude rescaled by a factor of three. (b–d) Number of peaks (# peaks) and mean biases (E[ΔX]) in peak angle (b), peak T 2, and peak squared normalised diffusion anisotropy estimated for three selected in silico systems. We refer the reader to Section 2.6 for a detailed description of the designed systems. Briefly, the displayed systems were designed by combining upto three discrete fibre components (D iso = 0.75 × 10⁻⁹ m2 s–1, D Δ = 0.9) with different signal fractions (1 − f thin) of a GM‐like component (T 2 = 90 ms, D iso = 0.8 × 10⁻⁹ m2 s–1, D Δ = 0.2). Here, we inspect a set of n fibre discrete fibres at various crossing angles θ cross (b), two‐fibre crossings for various T 2 values of the crossing fibre, T 2,cross (c), and two‐fibre crossings with varying f thin (d). In (b) and (c), we set 1 − f thin = 0.3, while in (b) and (d), we selected T 2,cross = 80 ms. The metrics were calculated across 40 different noise realisations; the points represent the mean over the various signal realisations, while the error bars indicate the standard deviation across signal realisations. The dashed grey line indicates the true number of peaks (left plots) or the zero‐bias line
