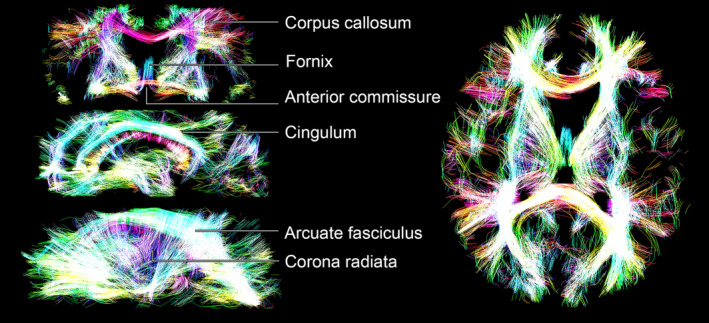
FIGURE 5.

Opacity rendering of streamline tractography data, where the opacity reflects streamline density (computed using a slice thickness of 3 voxels). The various tracks are coloured according to their orientation: red (left‐right), green (anteroposterior), and blue (superoinferior). The right‐side panels display one coronal slice (top) and two different sagittal slices (middle and bottom), while the left‐side panel displays an axial slice
