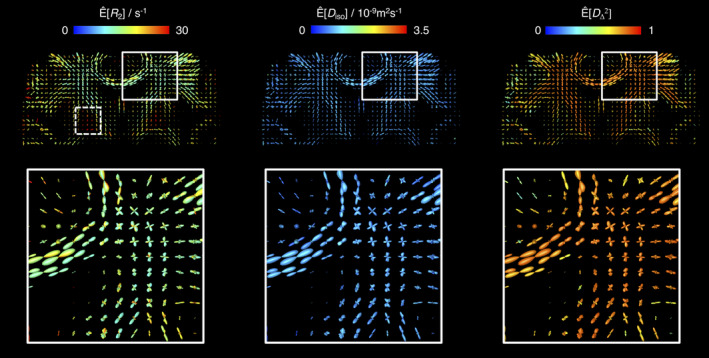
FIGURE 6.

Orientation Distribution Function (ODF) maps coloured according to orientation‐resolved means, Ê[X], of R 2, isotropic diffusivity D iso, and squared normalised diffusion anisotropy . All Ê[X] were calculated using Equation (9) and are displayed on a linear scale. The lower panel displays a zoom into a region containing fibre crossings between the corpus callosum and the corticospinal tract. The dashed‐line box in the top‐left map identifies the high‐R 2 fibres found in the globus pallidus
