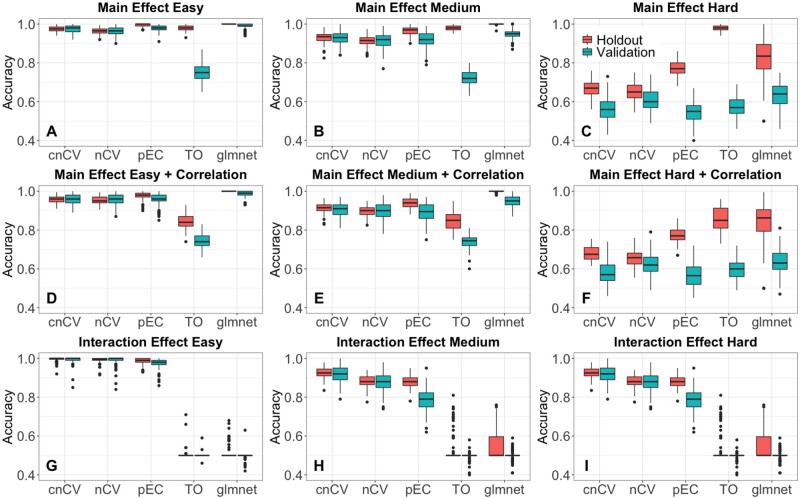
Fig. 3.
Simulated training/holdout and validation accuracy comparison. Accuracies for cnCV, standard nCV, pEC, differential privacy TO and glmnet for 100 replicate simulated datasets with main effects (A–C), main effects with correlation (D–F) and interaction effects (G–I). Training/holdout data (red) have m=200 samples, balanced cases and controls, and validation data (teal) have m=100 samples. Effect sizes range from easy to hard (left to right) with p=500 variables, 10% functional effects. Red boxplots indicate holdout accuracies (final holdout model from training) and teal boxplots indicate validation accuracies (final holdout model applied to independent data). Accuracies for all methods (except glmnet) are computed from random forest out-of-bag. Glmnet accuracies are computed from the fitted model coefficients and optimal elastic-net lambda and alpha parameters tuned by the CV. (Color version of this figure is available at Bioinformatics online.)

