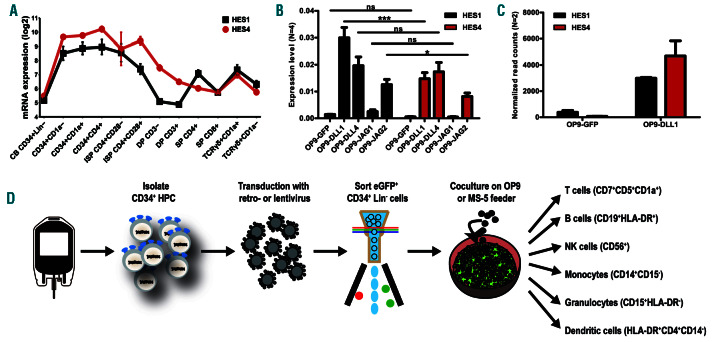
Figure 1.
HES4, like HES1, is expressed Notch dependently during human T-cell differentiation. (A) Line plots show log2 normalized probe intensities for HES1 (black) and HES4 (red) gene expression levels during normal T-cell development. Data shows the average expression of two independent experiments from two different donors. Error bars indicate the standard error of the mean (SEM). (B) Quantitative RT-PCR of HES1 (black bars) and HES4 (red bars) in CB CD34+Lin- precursors cultured for 3 days on OP9-GFP, OP9-DLL1, OP9-DLL4, OP9-JAG1 and OP9-JAG2. Data shows the average expression of four independent experiments, relative to the mean of GAPDH and YHWAZ mRNA levels. Error bars indicate SEM. ***P<0.001; *P<0.05 (two-way ANOVA); ns: not significant. (C) DESeq2-normalized read counts of HES1 (black bars) and HES4 (red bars) in thymic CD34+ cells cultured for 2 days on OP9-GFP and OP9-DLL1. Graphs show the average of two independent experiments and error bars indicate SEM. (D) Schematic overview illustrating the experimental workflow and the differentiation markers used to identify the different hematopoietic lineages.

