Figure 8.
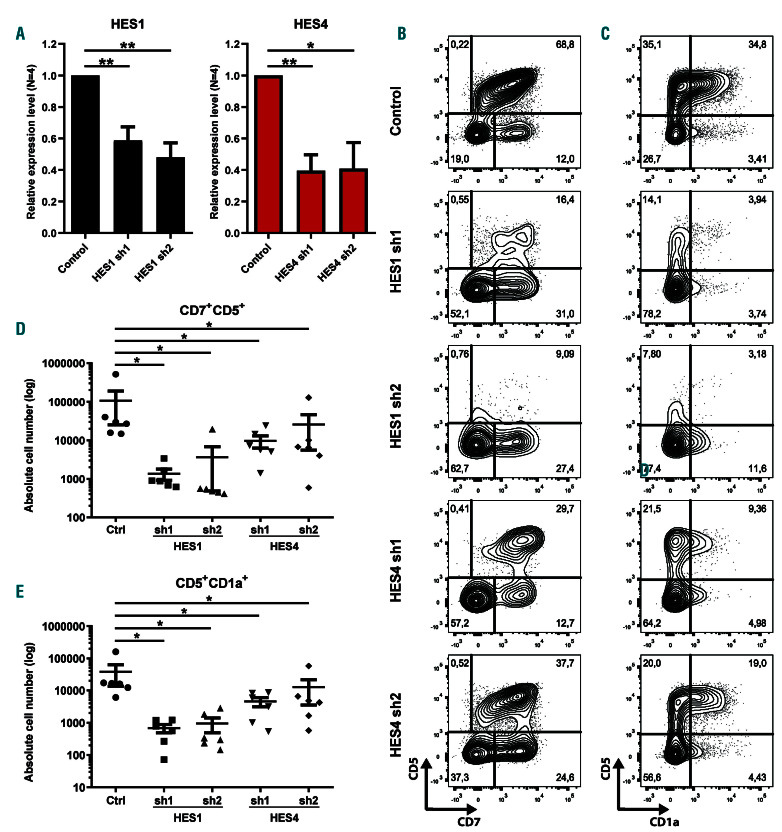
Non-redundant roles for HES1 and HES4 during early human T-cell development. (A) Quantitative RT-PCR of HES1 (black bars) and HES4 (red bars) in CB CD34+Lin– cells transduced with a control or two different HES1 or two different HES4 single hairpin RNA (shRNA), respectively, and cultured for 3 days on OP9-DLL4 to induce Notch activation. Data shows the average expression of four independent experiments, relative to the mean of ACTB and GAPDH mRNA levels, and normalized to expression in the control shRNA condition. Error bars indicate the standard error of the mean (SEM). **P<0.01; *P<0.05 (paired Student’s t-test). (B-C) Flow cytometry analysis of control, HES1 and HES4 shRNA-transduced CD34+Lin– hematopoietic progenitor cells (HPC) cultured on the OP9-DLL4 stromal cells for 2 weeks in the presence of the T-lineage supporting cytokines IL-7, SCF and FLT3L, showing the development of CD7+CD5+ (B) and CD5+CD1a+ (C) T-cell precursors. Contour plots shown are representative for six independent experiments. (D-E) Absolute numbers of CD7+CD5+ T-lineage specified (D) and CD5+CD1a+ T-lineage committed (E) progenitors generated in corresponding cultures shown in (B) and (C), respectively. Data shows the average of six independent experiments and error bars indicate the standard error of the mean (SEM). *P<0.05 (non-parametric paired Wilcoxon test).

